rate subsamples of soil (App. A). A few of the
Comparison of HMX concentration
acetone extracts were also analyzed by gas chro-
estimates from on-site colorimetric
matography with an electron capture detector
and laboratory methods for subgrid
(GC-ECD), primarily for analyte confirmation.
and grid-composite samples
HMX concentration estimates were obtained
Results for the on-site and acetone HPLC analy-
for all subgrid and grid-composite samples: 1)
ses for this group of 106 samples were compared
using the on-site colorimetric method (Jenkins et
using a paired t-test and linear correlation analy-
al. 1995), 2) using HPLC analysis at CRREL for
sis. The t value was 0.0596, indicating that the
the same acetone extracts employed for on-site
results from the two methods were not signifi-
analysis, and 3) at an independent commercial
cantly different at the 99.9% confidence level. From
laboratory using EPA Method 8330 which is an
linear correlation analysis, the correlation coeffi-
cient for the model with intercept was 0.992, the
HPLC method with acetonitrile extraction of sepa-
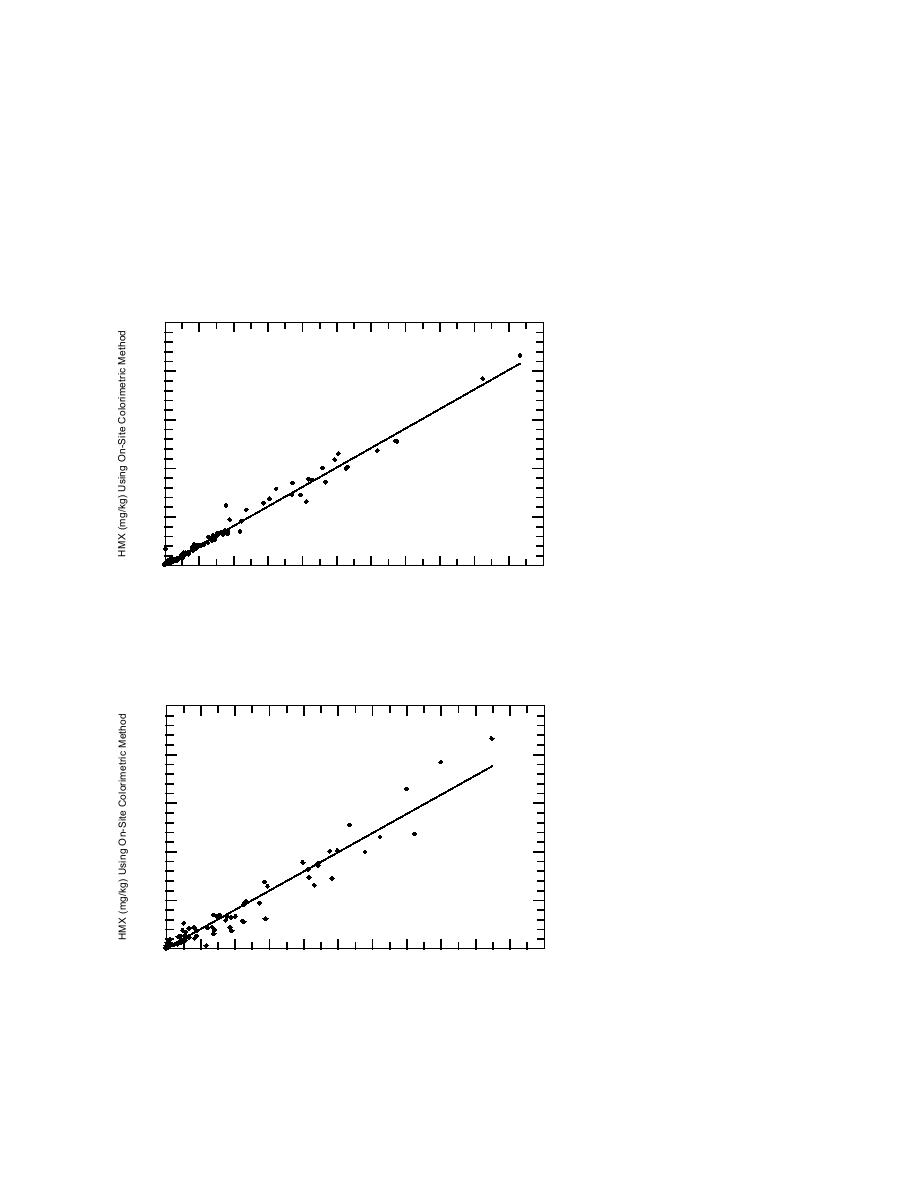
slope of the relationship was 1.008
and the intercept was 2.77. The in-
2500
tercept was not significantly differ-
ent from zero (t = 0.43) at the 99.9%
y = 1.0043x
r = 0.992
confidence level. The linear model
2000
with zero intercept had a slope of
1.004 (Fig. 12). This excellent corre-
1500
lation between these two indepen-
dent methods of instrumental
determination and a slope that
1000
matches the theoretically expected
value of 1.00, verifies that the on-
site method is providing concen-
500
tration estimates for HMX that are
equivalent to the HPLC estimates.
0
Results for the on-site method
0
200
400
600
800 1000 1200 1400 1600 1800 2000 2200
were also compared with those
HMX (mg/kg) Using Acetone HPLC Method
from the independent commercial
Figure 12. Correlation analysis of HMX concentration estimates from
laboratory (Method 8330). There
the colorimetric on-site method with those from HPLC analysis of the
were only 76 samples that could be
same acetone extracts.
correlated because duplicates were
not related one-to-one as they were
above where identical extracts were
2500
analyzed. The t value from the
paired t-test was 1.516, indicating
y = 0.9877x
that the results from the two meth-
r = 0.971
2000
ods were not significantly different
at the 95% confidence level. From
the correlation analysis, the slope
1500
of the model with intercept for this
analysis was 1.016 with an inter-
1000
cept of 25.0 and a correlation coef-
ficient of 0.972. The intercept was
not significantly different from zero
500
(t = 1.51) at the 95% confidence level
so the zero intercept model was ob-
tained. The slope of this relation-
0
0
200
400
600
800 1000 1200 1400 1600 1800 2000 2200
ship was 0.988 (Fig. 13). The corre-
Mean HMX (mg/kg) Using HPLC Method 8330
lation between these two methods
Figure 13. Correlation analysis of HMX concentration estimates from is also quite good, but not as good
the colorimetric on-site method with those from EPA Method 8330 using as that shown above where the
separate subsamples.
same extract was analyzed by two
18


 Previous Page
