25
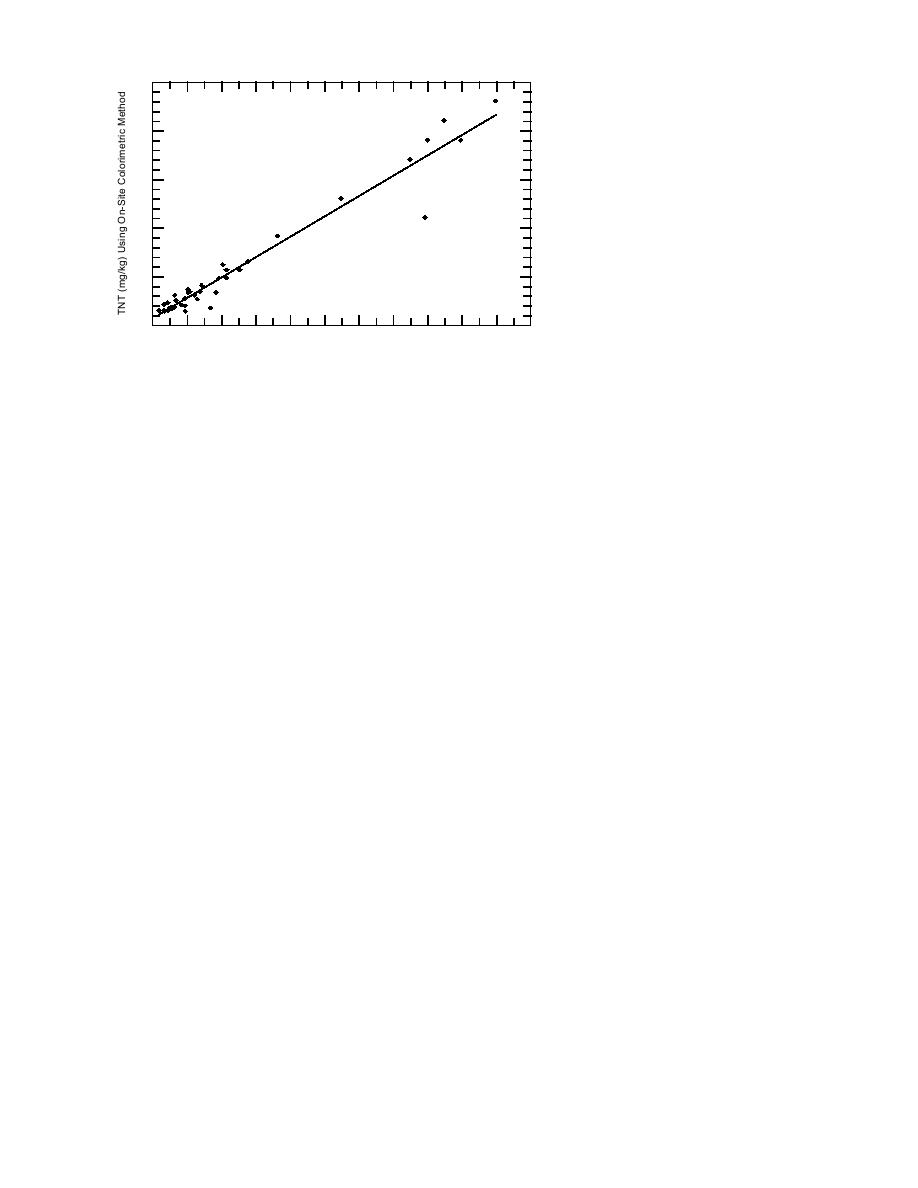
Correlation analysis was also con-
ducted on the numerical results from
y = 1.05x + 0.63
the on-site colorimetric and acetone
r = 0.983
20
HPLC analyses for the 41 subgrid and
n = 41
grid-composite samples where both
analyses resulted in a value above de-
15
tection limits (Fig. 15). The slope of
the linear model was 1.05 with an in-
tercept of 0.63; the correlation coeffi-
10
cient was 0.975. The slope was not
significantly different from 1.0 at the
5
95% confidence level, while the inter-
cept was significantly different from
zero at the 95% confidence level. This
0
indicates that the two methods pro-
0
2
4
6
8
10
12
14
16
18
20
22
vide very comparable results, with a
TNT (mg/kg) Using Acetone HPLC Method
Figure 15. Correlation analysis of TNT concentration estimates from very slight positive bias in the results
the colorimetric on-site method with those from HPLC analysis of the from the colorimetric method. This
slight positive bias may be a result of
same acetone extracts.
our decision to subtract twice the ini-
tial absorbance from the final absor-
bance, when computing the TNT concentration
while 42 were confirmed by Method 8330 and
using the colorimetric result (Jenkins 1990). EnSys
seven were classified as false positives.
recommends subtracting four times the initial ab-
The agreement of samples with values above
sorbance from the final absorbance (EPA Method
detection using on-site methods, relative to
8515) and if we computed it using this approach,
Method 8330, has been commonly used to com-
the bias may have been eliminated. However, we
pute the percentage of false positives and false
chose the factor of two, rather than four, to guard
negatives. Usually the lack of agreement has been
against false negative results. Correlation of the
attributed to a failure on the part of the on-site
on-site colorimetric results with those from
method. Yet if we look carefully at the data in
Method 8330 was not conducted due to the large
Table 8, clearly this interpretation is misleading.
problem with heterogeneity discussed earlier.
For example, consider sample D9C where Method
8330 gave a concentration of 111 mg/kg, the high-
Correlation analysis was also conducted be-
est value found, whereas the EnSys, D TECH and
tween the results from the D TECH EIA method
acetone HPLC were all non-detects. Clearly this
with those from acetone HPLC (Fig. 16). To con-
duct this analysis, we paired the result of the
is not a failing of the on-site methods, since three
acetone HPLC analysis with the midpoint of the
independent methods using the same extract con-
range produced by the D TECH test for the 40
cur that the concentration of TNT is low. More
samples, where both methods produced a result
likely this is due to a small chunk of TNT being
above detection limits. When this was done, the
present in the subsample used for Method 8330
slope of the linear model was 0.69 with an inter-
analysis. In fact the Method 8330 result presented
cept of 1.24 and a correlation coefficient of 0.91.
for TNT was actually a mean of duplicates; the
Neither the slope or the correlation was as satis-
individual determinations on separate subsamples
factory as with the colorimetric method.
were 220 mg/kg and 1.6 mg/kg, respectively. In
a similar manner, if we look at sample D9CC2,
the Method 8330 result for this sample was <0.3
Co-contaminants
At sites contaminated with TNT, co-contami-
mg/kg while those for the EnSys, D TECH and
nants may include biotransformation products (2-
acetone HPLC were 17 mg/kg, 1216 mg/kg, and
amino-DNT, and 4-amino-DNT), photodegrada-
15 mg/kg, respectively. This sample came from
tion products (TNB), and manufacturing by-
the same subgrid as sample D9C discussed above.
products (DNT and DNB). In several of the grids
Thus both spatial and subsampling heterogeneity
sampled at this site, we found both isomers of
must be kept in mind when attempting to assess
false positives and false negatives with on-site
amino-DNT, indicating that biotransformation of
TNT is taking place and this process likely con-
methods for explosives.
22


 Previous Page
