Thus for the replicate samples, a
Table 6. HMX concentrations from on-site colorimetric analysis for
subgrids subjected to repeat sampling.
different 10% of the surface area
within a subgrid was sampled.
HMX (mg/kg)
Replicate
HMX results from on-site analy-
Subgrid
Replicate 1
Replicate 2
variability*
Variance
RSD(%)
sis for the initial and replicate
†
††
D2C
341
210
1.6
8581
33.6
samples are presented in Table
6. The variability observed for
37†
111††
D2D
3.0
2738
70.7
the two replicates for a given
444††
D4A
631
1.4
17485
24.6
subgrid was much lower than
observed between subgrids
649††
D7C
729
1.6
3200
8.2
within the grid. Thus even with
116††
D9B
180
1.6
2048
30.6
this enormous short- and mid-
††
range variability present, we
D9
20
1.4
14.2
173
123
were able to reproduce most
4.1††
D10A
25
6.1
218
102
subgrid values within a factor
††
C4A
1910
1170
1.6
276025
34.0
of two, especially when the
HMX concentration was above
871††
C4C
995
1.1
7688
9.4
50 mg/kg. We did not conduct
Mean (all)
48.5
analysis of variance on these
Mean (conc.> 50)
30.1
data, however, since the vari-
Mean replicate variability (all values) = 3.6
ances obtained for the different
Mean replicate variability (conc. > 50) = 1.7
subgrids were clearly not homo-
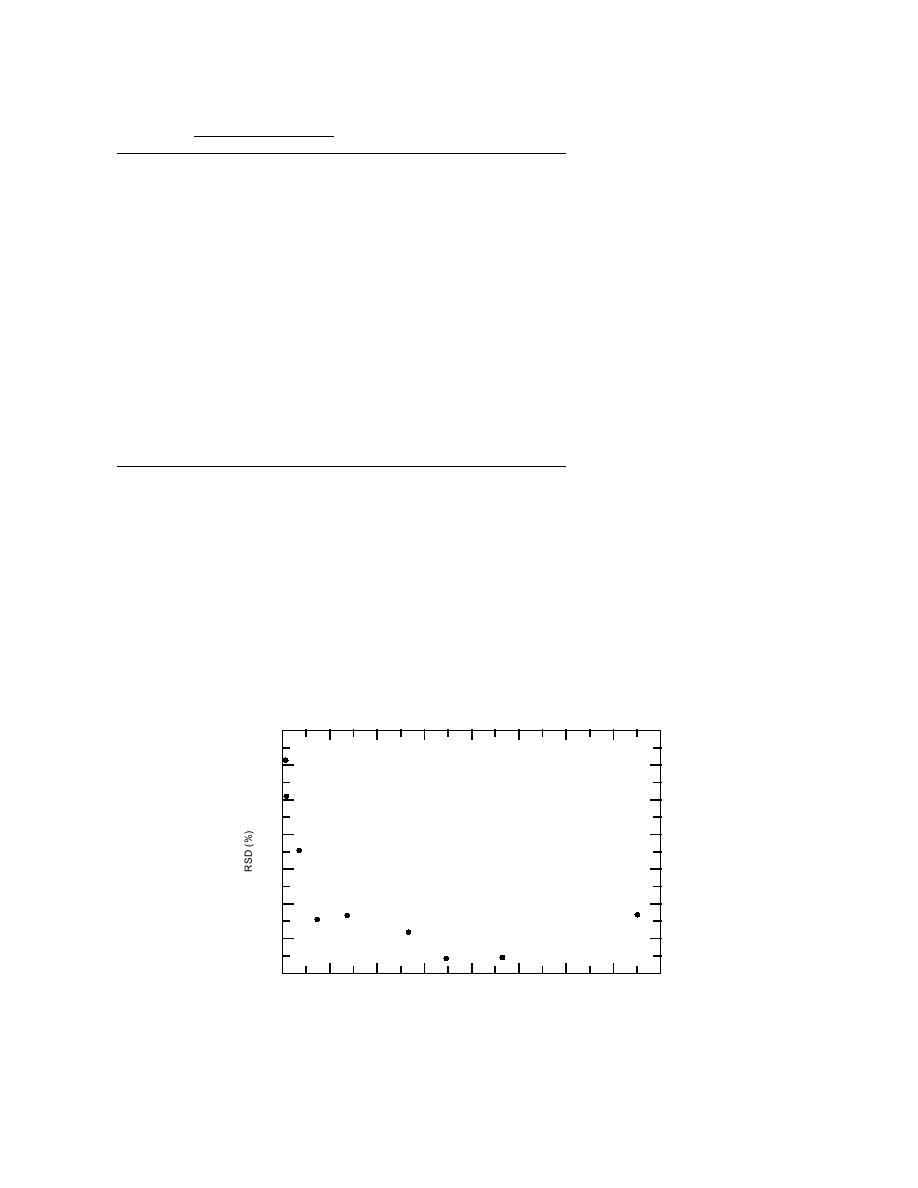
geneous. In fact, the RSDs ob-
* Replicate variability is the higher value/lower value of replicates.
† Value randomly selected from two analytical replicates.
tained for individual subgrids,
†† Value randomly selected from two subsampling replicates.
which ranged from 8.2% to
123%, were inversely related to
concentration (Fig. 11). This relationship is remi-
This was done two days following the initial
niscent of the relationship developed by Horowitz
subgrid sampling. No precipitation occurred be-
(1982) who demonstrated that analytical standard
tween the period of the initial and subsequent
deviations were a function of concentration for a
subgrid sampling events. Resampling was con-
wide variety of analytical methods and for all
ducted in an identical manner to that used for the
types of matrices.
initial subgrid samples except the regions sampled
The within-subgrid-scale uncertainty is a com-
were offset from the center of the subgrids as
bination of analytical error, subgrid subsampling
shown in Figure 4 for each subgrid resampled.
140
120
100
80
60
40
20
0
0
200
400
600
800
1000
1200
1400
1600
HMX Mean Concentration (mg/kg)
Figure 11. Dependence of RSDs of duplicate subgrid samples on mean
HMX concentration.
16


 Previous Page
