Statistical analyses
Chemicals and reagents
To detect significant concentration differences
All standards for HMX, TNT and the other
among the seven sample positions for the short-
explosives analytes were prepared from Standard
range heterogeneity study (wheel samples from
Analytical Reference Materials (SARMS) obtained
D2B), we subjected analytical results for HMX
from the U.S. Army Environmental Center,
from the on-site colorimetric method, from the
Aberdeen Proving Ground, Maryland. Standards
acetone HPLC method, and from Method 8330 to
of HMX and TNT in acetone were prepared using
one variable of classification, completely random-
OmniSolv grade acetone from EM Science.
ized analysis of variance (ANOVA) using
All acetone used for soil extraction and glass-
Microsoft Excel 5.0. Since the ANOVA demon-
ware cleaning was reagent grade obtained from
strated significant differences among sample
Anachemia. Methanol used in the laboratory for
positions for this sampling location, least signifi-
preparation of HPLC eluents was either Caledon
cant differences (LSDs) were computed to iden-
or Sigma-Aldrich HPLC grade. Deionized water
tify specific differences. Variances were fraction-
from the DREV central system was used in the
ated to yield estimates of the standard deviations
field for cleaning, and for addition to extracts to
for subsampling plus analysis (SA) and for sam-
ensure that an adequate water content was present
for the color-forming reaction. Laboratory grade
pling error (SS). All references to analytical error
water used for preparation of HPLC eluents at
for this portion of the study should be under-
CRREL was obtained from a Millipore Milli-Q
stood to include contributions from mixing and
Type 1 reagent grade water system.
subsampling, extraction, dilution, measurement
and concentration computations, while
sampling error refers to spatial heteroge-
D2B
neity at the sampling location. We also
computed means and standard deviations
of duplicates, overall means of the seven
duplicates, plus means and standard de-
viations of composites. Analytical preci-
sion of the seven duplicates for each sam-
pling location and each analysis method
was expressed as the average of the seven
RSDs (relative standard deviations).
Correlations based on the linear least
C4CC
squares model with intercept were made
between the HMX results from the on-
site colorimetric method and both the
Method 8330 results and those from
acetone HPLC analysis. Computations
were conducted separately for the results
from the short-range heterogeneity study
and for the data from subgrid and grid-
composite samples. Intercepts were tested
to determine whether they were signifi-
Standard
cantly different from zero at the 95%
confidence level. When appropriate, zero
intercept models were fitted.
RESULTS AND DISCUSSION
Depth of contamination
In the initial stages of this work we
Retention Time (min)
collected three 015-cm cores plus three
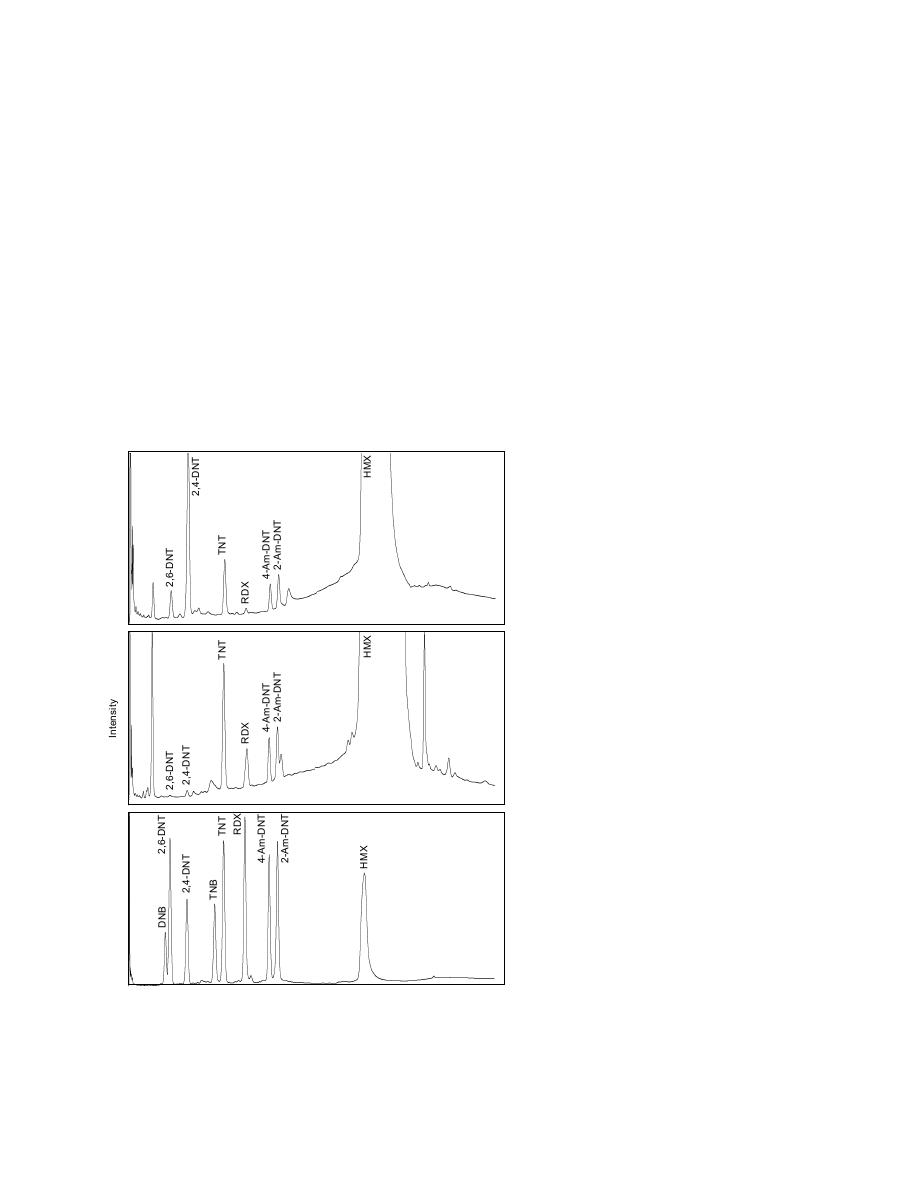
Figure 9. GC-ECD chromatograms for a standard and two ac-
colocated 02.5-cm surface samples at
etone soil extracts.
each of two locations near target tank D.
9


 Previous Page
