54 Colorimetric
16 Colorimetric
75 Acetone HPLC
16 Acetone HPLC
7
2
82 Method 8330
12 Method 8330
100 Colorimetric
111 Acetone HPLC
170 Method 8330
183 Colorimetric
324 Colorimetric
190 Acetone HPLC
325 Acetone HPLC
6
1
3
285 Method 8330
405 Method 8330
12
2c
m
dia
me
ter
Samplers
(stainless steel auger)
5 cm diameter
111 Colorimetric
321 Colorimetric
5
4
142 Acetone HPLC
328 Acetone HPLC
135 Method 8330
300 Method 8330
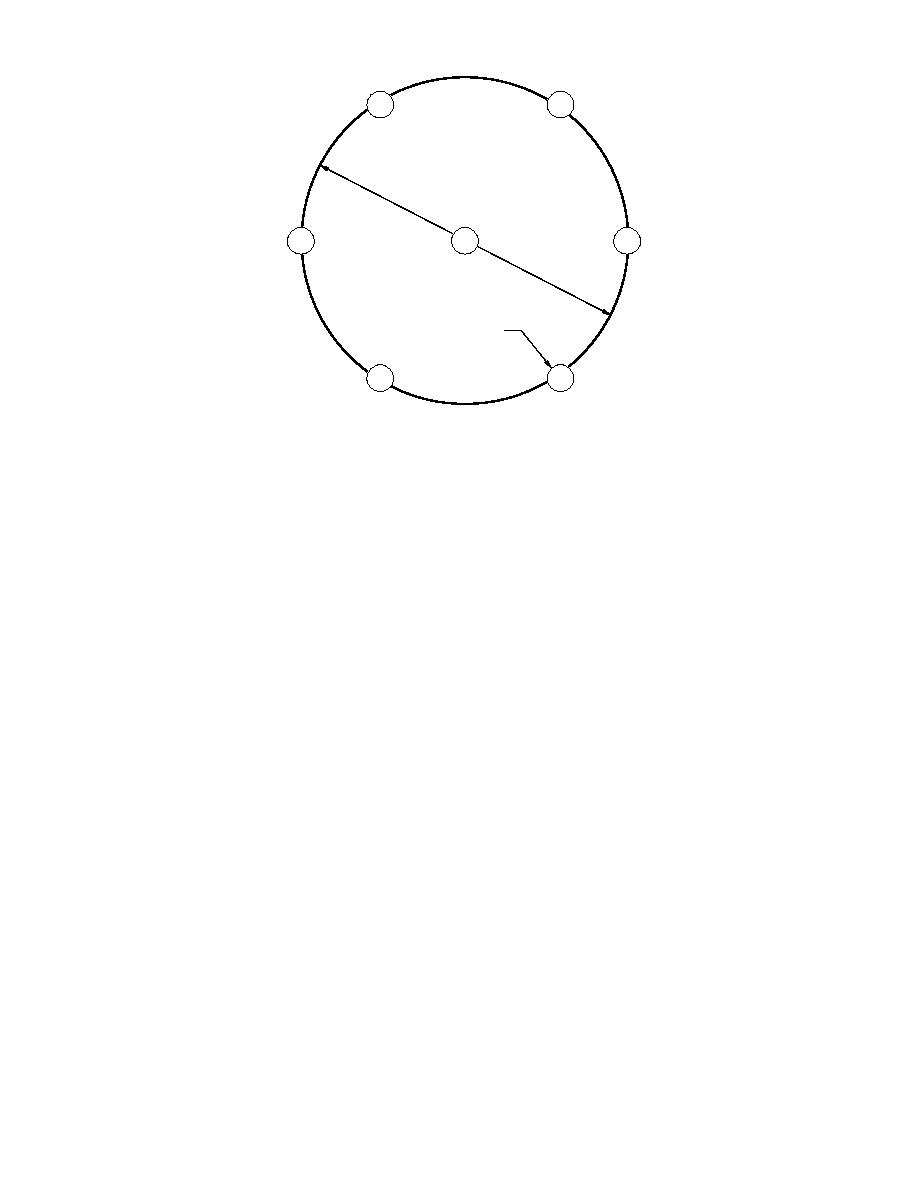
Figure 5. Sampling scheme for short-range heterogeneity study (HMX concentrations are
shown from subgrid D2B). Numbers 17 are discrete samples collected in a localized area.
Values are in milligrams/kilogram.
and between these two tanks was unvegetated.
was carefully cleaned with a brush prior to its
Behind tank D, the soil was moist and moss cov-
next use.
ered. In the initial stage of the investigation, pre-
Based on the results of the on-site analyses
liminary soil samples were collected in two areas
from the first two sets of samples, we divided the
area around tanks C and D into ten 6- 6-m grids
to assess the near-surface concentration gradient
of HMX and TNT with soil depth. This sampling
(labeled D1 through D10, and C4 and C5) and
subdivided each grid into four 3- 3-m subgrids
was done using a 2.5-cm soil corer, and samples
were collected over two depth regions: 0 to 7.5 cm
as shown in Figure 4. Subsequently the Canadian
and 7.5 to 15 cm. Colocated surface samples (0
researchers alone added grids C6 through C10
2.5 cm) were also collected for comparison. Cores
and D11. These samples were analyzed only by
were divided in the field and returned to the
Method 8330. The following procedural details
sample processing area in plastic bags.
applies only to the characterization of the first 10
The second set of soil samples was collected
grids. Samples within each subgrid were obtained
near tank D (in an area subsequently labeled
as follows. A spading shovel was used to scrape
subgrid D2B) to provide an estimate of short-
the top 5 cm of soil from a 20-cm wide circular
range heterogeneity in HMX and TNT concentra-
path of radius 77 cm located in the center of each
tions that could be compared with results ob-
subgrid; this path sampled about 10% of the sur-
tained for other explosives-contaminated sites
face within the subgrid (Fig. 6). The soil scraped
(Jenkins et al. 1996). For this portion of the work,
from the surface was piled in the center of the
a plastic template was placed on the ground with
circle and mixed thoroughly with the spading
the center at the selected sampling location, and
shovel and a small hand shovel (Fig. 7). Pieces of
seven samples were collected in a wheel pattern,
metallic and ceramic debris from munition deto-
with sample number 1 in the center (Fig. 5). The
nation were removed by hand and a subsample
radius of the wheel was 61 cm and samples ar-
of about 1 kg of soil was collected from random
ranged around the wheel were separated by 61
locations in the pile. Duplicate portions of soil
cm. All seven soil samples were collected from 0
from these soil piles were collected in nine ran-
to 15 cm using a manual 5.6-cm-diam. stainless-
domly selected subgrids from a total of 40 to as-
steel hand auger. Vegetation when present was
sess the degree of uncertainty due to subsampling
removed. Cores were transferred to plastic Ziploc
the piles. Samples prepared in this manner were
bags and taken to a processing area. The auger
designated area integrated. In these same nine
4


 Previous Page
