water to reduce salt accumulation. Ten times dur-
ing the experiments leachates were collected and
analyzed for pH and heavy metals. The plants
were harvested on 23 April 1996, rinsed in deion-
ized water, and separated into shoots, crowns,
and three root samples from the three soil zones.
The plant material was frozen until ready for
analyses.
Leachates were analyzed for Zn, Pb, Cu, Cd,
and pH. Samples were refrigerated after samp-
ling, but were not filtered. There was no visual
evidence for any significant movement of sus-
pended material or organics as judged by settling
out of suspension or discolored solutions. Work-
ing standards for heavy metals were prepared
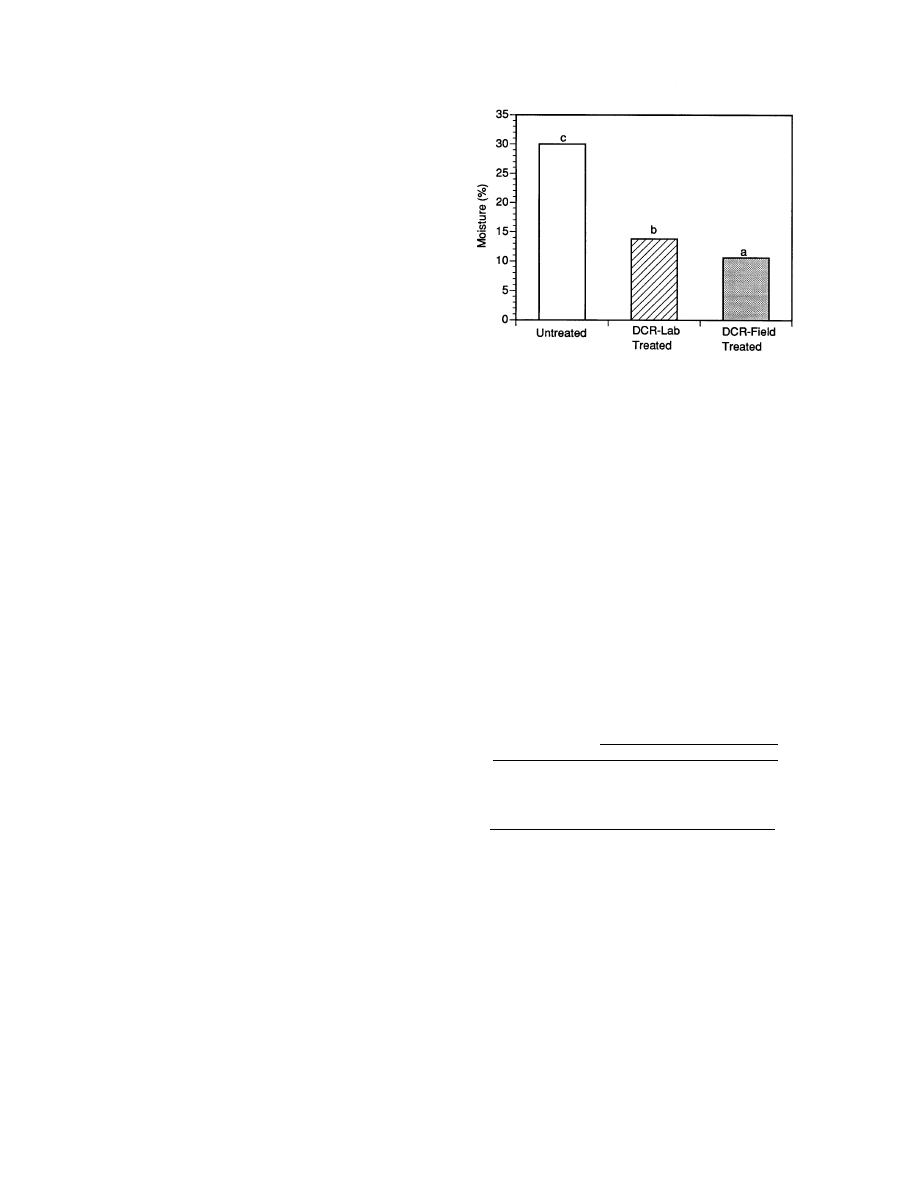
Figure 2. Water content of untreated soil-asphalt tar
from 1000-ppm Fisher primary standards. A
and laboratory and field DCR-treated material.
Perkin-Elmer Model 5000 atomic absorption
spectrophotometer (AAS) was used for the heavy
The hydraulic conductivity was determined
metal analyses. The pH meter was calibrated
on three DCR-treated asphalt tar samples sub-
with Fisher standards at pH = 10.00 0.02 and pH
jected to a single freeze-thaw cycle. Although the
= 7.00 0.01.
hydraulic conductivity increased with a single
The plant material was dried in an oven at
freeze thaw cycle, the difference was not signifi-
80C, then ground in a stainless steel Wiley mill to
cant (Table 3). Because of the high levels of sand
pass a 20-mesh screen. Subsequent plant process-
and gravel in the raw waste, the DCR-treated tar
ing for heavy metal analyses closely followed the
material was coarse-textured. As a consequence,
procedures used by Brown et al. (1994). Briefly,
the hydraulic conductivity was high (Table 3).
plants were ashed at 480C for 16 hours, digested
Reduction of hydraulic conductivity to a regula-
tory limit of 1.0 105 cm s1 for some applica-
with 5 mL of concentrated HNO3, evaporated to
dryness, taken up in 5 mL of 3 M HCl, and then
tions (e.g., landfill covers) will necessitate mixing
diluted to volume (25 mL) with 1 M HCl. Blanks
of the treated material with finer-textured silts
were carried through the identical process. These
solutions were analyzed on a Perkin-Elmer
Table 3. Changes in hydraulic conductivity
model 5000 AAS. Working standards were pre-
after one freezethaw cycle.
pared from primary standards (Fisher, 1000 mg
Dry
L1) and contained the same HCl concentrations
Hydraulic conductivity (cm sec1)
Sample
density
as the samples to assure a similar sample matrix.
(g cm3)
no.
0
1
Ratio
1.03103
1.12103
1
1.41
1.09
RESULTS AND DISCUSSION
5.76104
9.85104
2
1.36
1.71
2.06104
2.67104
3
1.37
1.30
Shemya study
6.04104
7.91104
Mean
1.38
1.37
This study involved more physical testing of
the treated material than the subsequent studies,
and clays. A single freeze-thaw cycle increased
because there was interest in possibly using this
the hydraulic conductivity by 37% (Table 3),
material for either road subgrade or in a landfill
which agrees with Chamberlain (1994) who
cover in an area subject to freeze-thaw cycles.
found that the hydraulic conductivity of most
The water content of untreated asphalt tar was
compacted clays increased significantly after
around 30% by weight; both laboratory and field
freezing and thawing. Chamberlain (1994) re-
DCR-treated asphalt tar material contained sig-
ported that freeze-thaw cycles are the major prob-
nificantly less moisture (Fig. 2). This dehydration
lem affecting the design and performance of
of the treated material is partly due to formation
landfill containment structures and surface im-
of Ca(OH)2 and partly due to release of steam in
poundment systems in cold regions. The coarse
the exothermic reaction (eq 1). The laboratory
texture and high hydraulic conductivity of this
treated material contained significantly higher
DCR-treated tar-soil mixture may limit potential
water compared to field treated material.
reuse.
8


 Previous Page
