0.010
Before
After
0.008
0.006
d. SRW I.
0.004
0.002
0.000
0.001
1000
0.01
0.1
1
10
100
Diameter (m)
0.010
Before
After
0.008
0.006
e. SRW J.
0.004
0.002
0.000
0.001
0.01
0.1
1
10
100
1000
Diameter (m)
0.006
Before
0.005
After
0.004
f. SRW K.
0.003
0.002
0.001
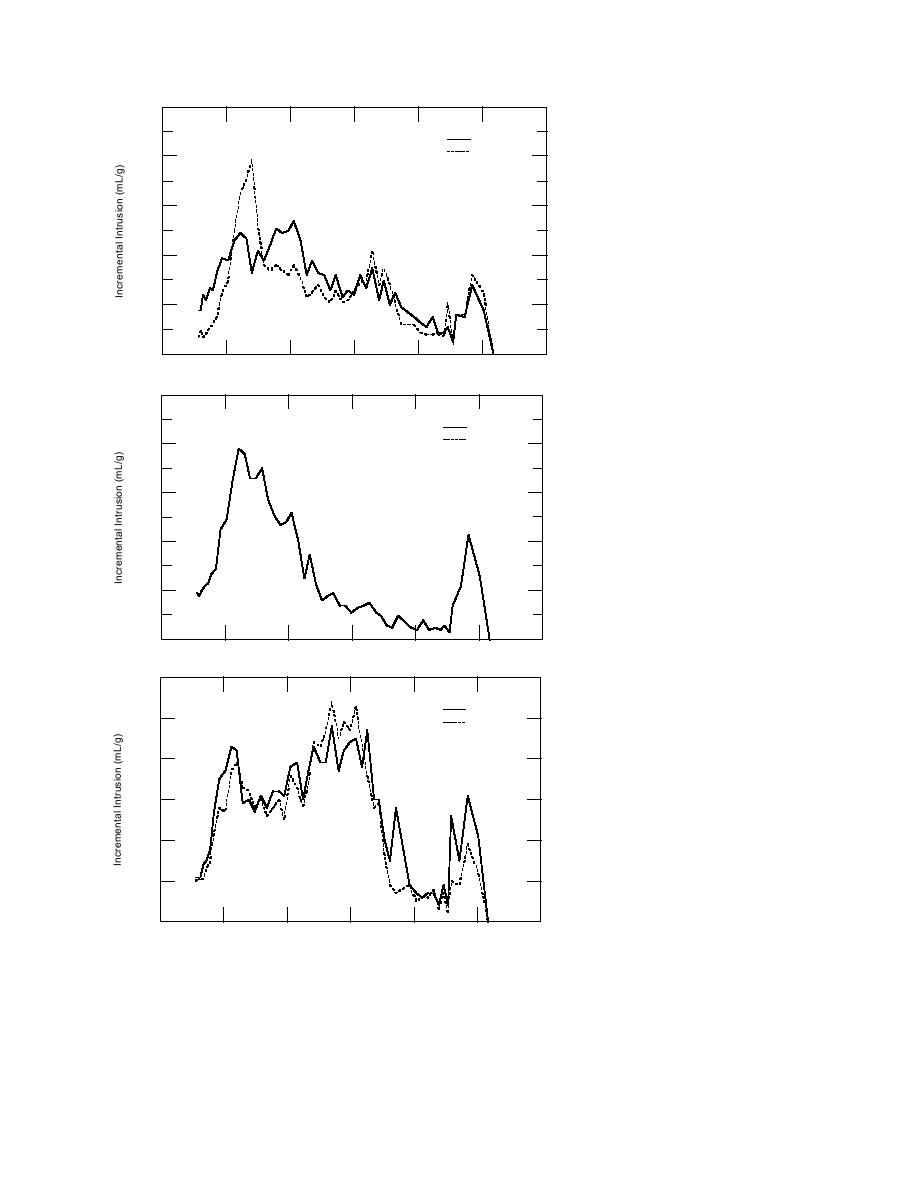
Figure 18 (cont'd). Pore size distribu-
tions before and after freezing and
0.000
thawing.
0.001
1000
0.01
0.1
1
10
100
Diameter (m)
between the results of these tests and the other
The second objective was to determine if this
test methods are summarized in the next section
method would detect changes in the pore size
of this report.
distribution of the test specimen due to freezing
and thawing action.
Comparison of test results
Based on these results, MIP tests performed
Table 10 compares the results of the different
before and after freezethaw cycling do not show
test methods for six sets of test specimens classi-
the expected increases in pore size. Comparisons
22


 Previous Page
