0.010
Before
After
0.008
0.006
a. SRW A.
0.004
0.002
0.000
0.001
1000
0.01
0.1
1
10
100
Diameter (m)
0.004
Before
After
0.003
b. SRW G.
0.002
0.001
0.000
0.001
0.01
0.1
1
10
100
1000
Diameter (m)
0.005
Before
After
0.004
0.003
c. SRW H.
0.002
0.001
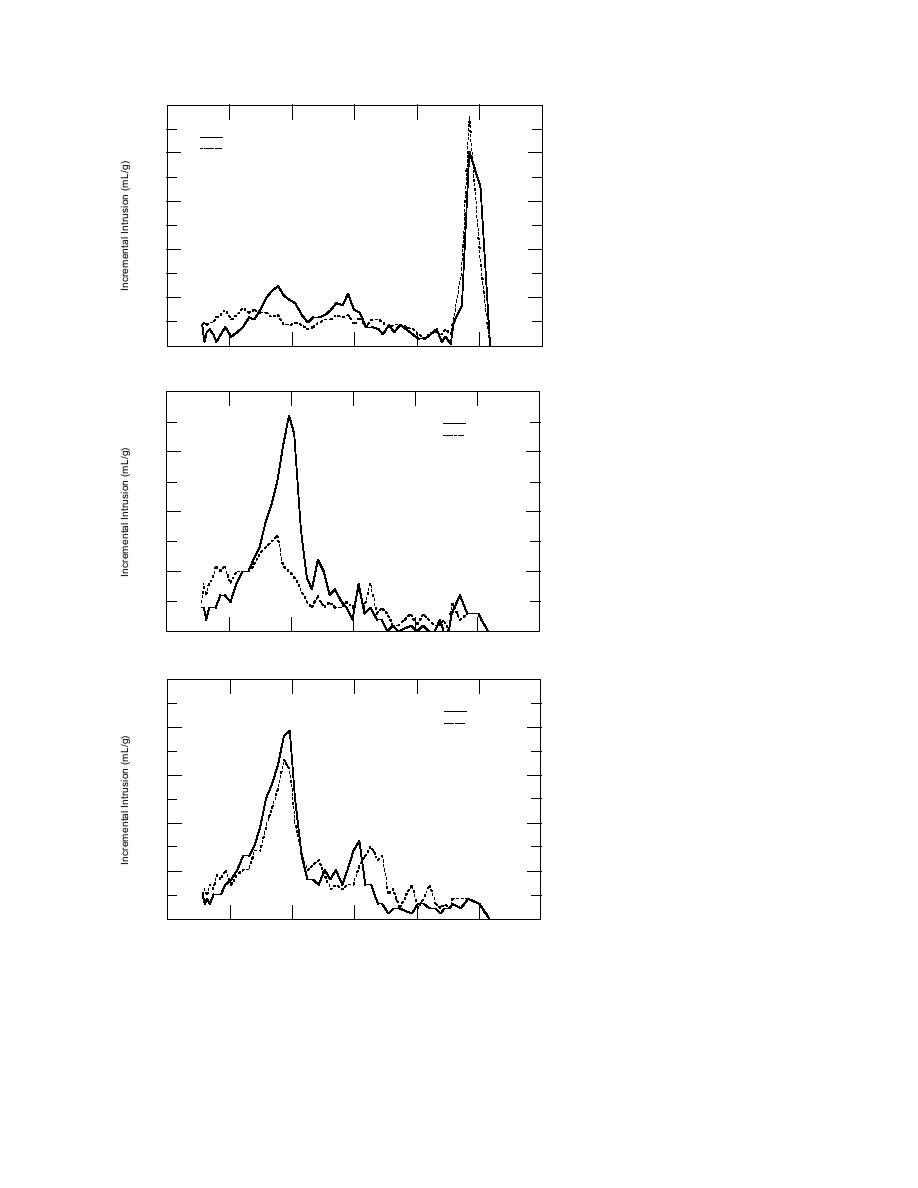
Figure 18. Pore size distributions before
and after freezing and thawing.
0.000
0.001
0.01
0.1
1
10
100
1000
Diameter (m)
cury intrusion porosimetry (MIP) test. The tests
them freezes at common low temperatures. Sub-
were conducted in replicate specimens before
capillary pores also have very high suction prop-
and after 300 ASTM C 666 freezethaw cycles.
erties that keep them filled with moisture, but
There were two objectives in using this MIP test.
due to the small sizes of these pores the moisture
The first was to see if there may be a reasonable
within them is maintained in a supercooled con-
correlation between pore size distribution in con-
dition without freezing.
crete masonry units and freezethaw test results.
Figure 18 shows the test results from the mer-
21


 Previous Page
