60
40
20
0
20
1990-91
40
60
60
40
20
0
20
1991-92
40
60
60
40
20
0
20
1992-93
40
60
10 20
10 20
10 20
10 20
10 20
10 20
10 20
10 20
10 20
Apr
May
Sep
Oct
Nov
Dec
Jan
Feb
Mar
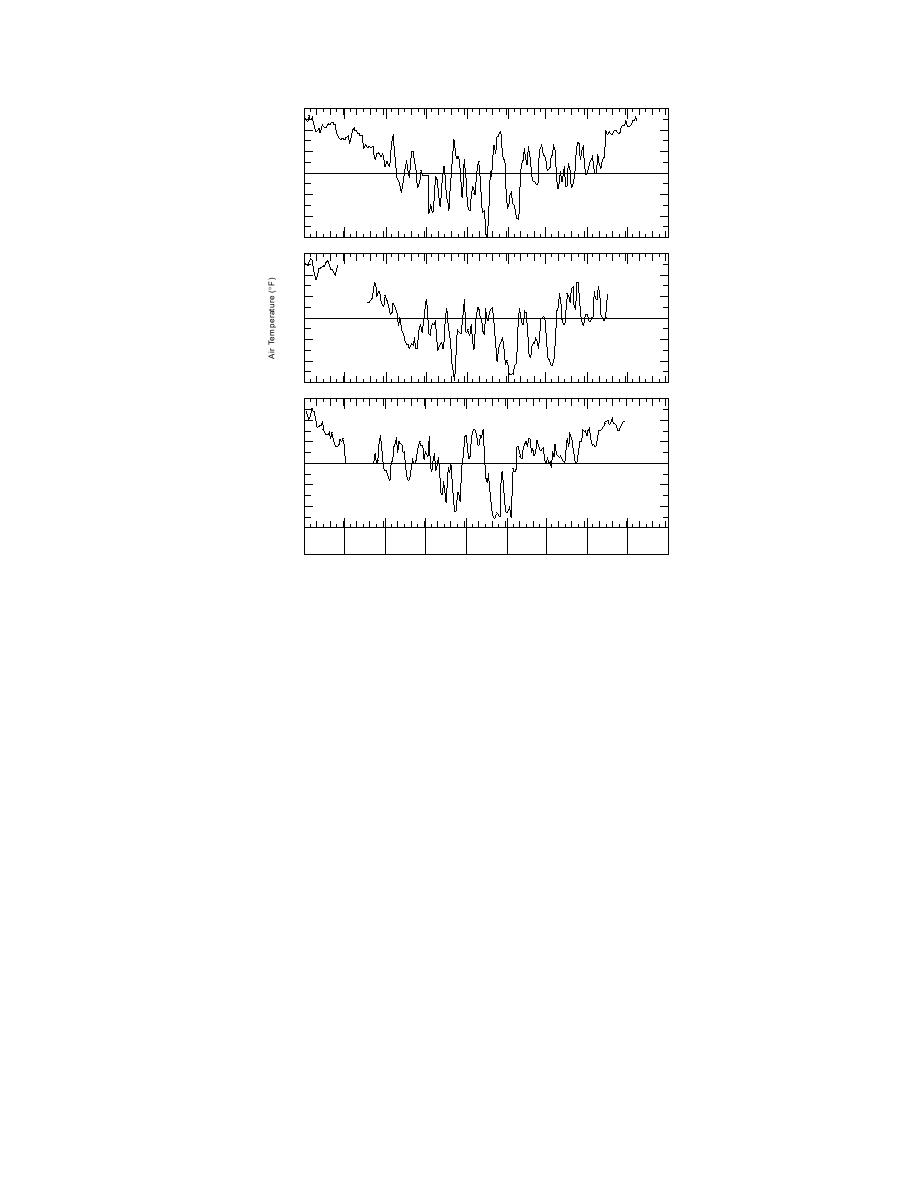
Figure 11. Average daily air temperatures.
from the bottom corner of the footing regardless
sporadic. During the final year the readings were
of the frost load. It is also interesting to note that
recorded regularly on an established schedule.
the maximum frost penetration next to the foot-
Freezing indices for the three winters were 5600,
6100, and 5500 F-days, respectively.
ing occurs in early to mid February, whereas in
the control area this occurs in the more traditional
All three winters were at least as cold as the
average of 5500 F-days, with two being 2% and
time frame of mid to late March.
Figure 15 shows the temperature difference
11% colder than average. The 199192 winter was
2% colder than the design index of 6000 F-days.
above and below the horizontal insulation ap-
proximately 3 ft out from the footing. The figure
Average daily air temperatures for the three win-
illustrates the effectiveness of the insulation to re-
ters are shown in Figure 11.
Figures 1214 illustrate the 32F isotherms for
tard heat loss from the foundation and surround-
ing ground. Even with winter temperatures of
various dates throughout the winter. The iso-
10F above the insulation, the temperature
therms in Figure 12 are truncated because the
under the insulation seems to hover around 30F,
frost penetrated deeper than the sensors that
with periods where it may vary by a couple of
were installed at that time. Additional sensors
degrees, but never falls lower than 24F.
were placed deeper the following winter, and
There are two areas where temperatures are
sensors were also installed to provide a more de-
critical around an SIF: the first is under the toe of
tailed temperature regime under the insulation. It
the footing (sensor B25) and the second is under
is apparent from the figures that at no time dur-
ing the monitoring period did the 32F isotherm
the floor slab (sensors A1 and A3). Figure 16
shows that the temperature never gets lower than
threaten the bottom of the footing. As expected,
34F at the toe of the footing. It also shows that
the depth of frost on the far right side of the fig-
the temperature below the floor insulation gets
ures (areas assumed not to be influenced by heat
below 37F for only a short period of time. As ex-
loss from the foundation, i.e., control area) were
pected, temperatures under the floor insulation
deeper during the colder 199192 winter than the
at the outside edge of the slab (sensor A1) are
others. However, it seems that the freezing front
lower than those at the center (sensor A3). Unfor-
never gets closer than approximately 612 in. out
7


 Previous Page
