60
Sensor B25
1990-91
1991-92
1992-93
50
40
30
10 20
10 20
10 20
10 20
10 20
10 20
10 20
10 20
10 20
Sep
Oct
Nov
Dec
Jan
Feb
Mar
Apr
May
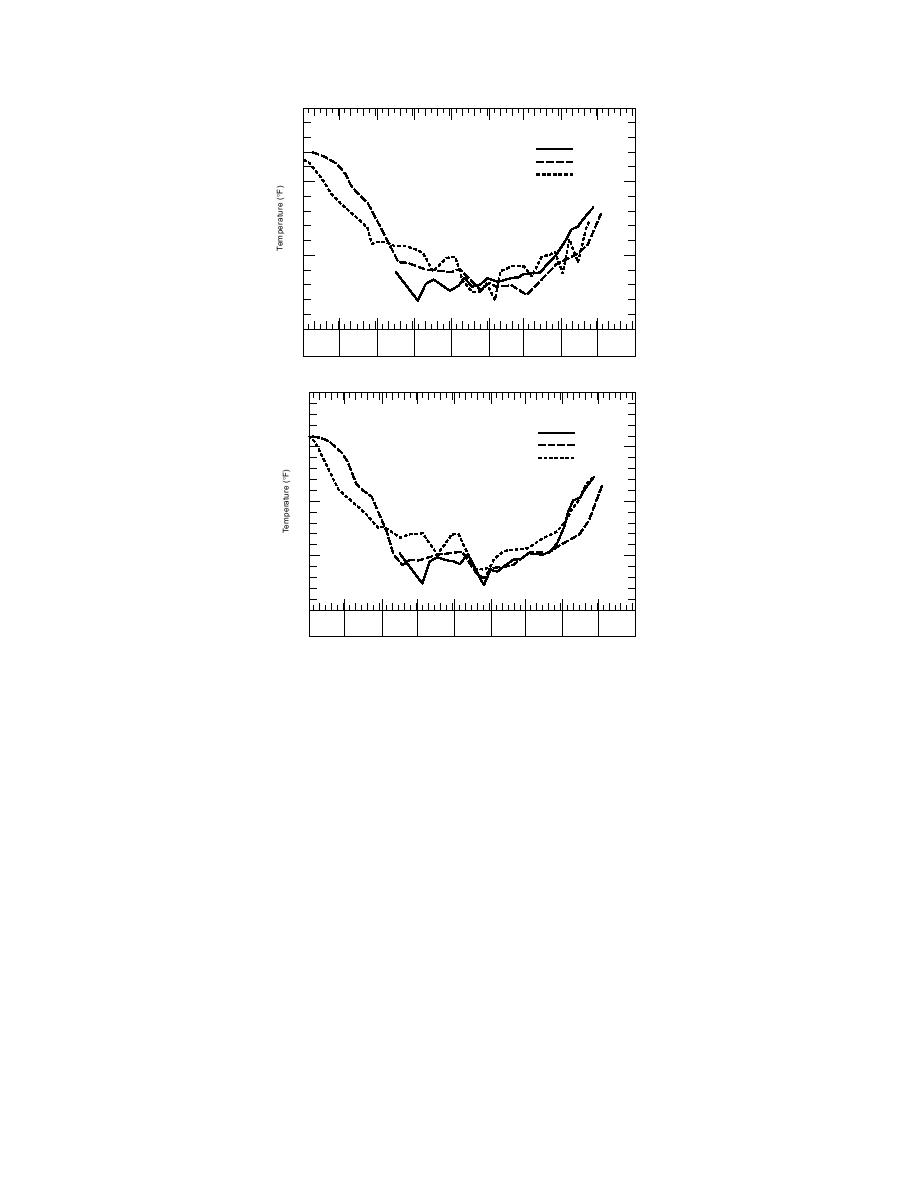
Figure 17. Yearly temperatures at toe of footing.
60
Sensor A27
1990-91
1991-92
50
1992-93
40
30
20
10 20
10 20
10 20
10 20
10 20
10 20
10 20
10 20
10 20
Sep
Oct
Nov
Dec
Jan
Feb
Mar
Apr
May
Figure 18. Yearly temperatures under horizontal ground
insulation.
creases. All the measurements were taken 2 ft be-
indices, with the 199192 winter being the most
low grade. Sensor A6 is located under the center
severe and the 199091 and 199293 winters be-
of the addition, B25 at the toe of the footing, A28
ing less severe and approximately equal. This
under the center of the horizontal ground insula-
holds true for the end of the freezing season;
tion, and B4 in the control area. The figure also
however, it becomes evident in the figures that at
shows how the soil temperatures under the foun-
the beginning of the 199091 season the tempera-
dation (i.e., A6 and B25) change very little from
tures are uncharacteristically cold. This was the
winter to winter even though the freezing indices
winter when the addition was still under con-
are quite different.
struction and was heated only occasionally until
the first of December. Figure 19 further illustrates
the importance of using the heat loss from the
CONCLUSIONS
building in an SIF design. Given that the 199091
The shallow insulated foundation used at the
and the 199293 winters had approximately the
addition for the Galena, Alaska, aircraft control
same indices, the temperatures at the sensors are
tower was a cost-effective alternative to a more
clearly lower for the 199091 winter than for the
conventional footing design. Placed at only 20 in.
199293 winter. Assuming the heat was on consis-
below grade where the expected frost depth may
tently from December 1, 1990, it took almost two
reach 12 ft, the shallow foundation was protected
months for the temperatures to return to values
from potential frost damage by extruded poly-
similar to the 199293 winter values.
styrene insulation. Because the site is unique
Figure 20 shows how temperatures decrease as
(i.e., remote), an accurate estimate of economic
the distance from the heated foundation in-
10


 Previous Page
