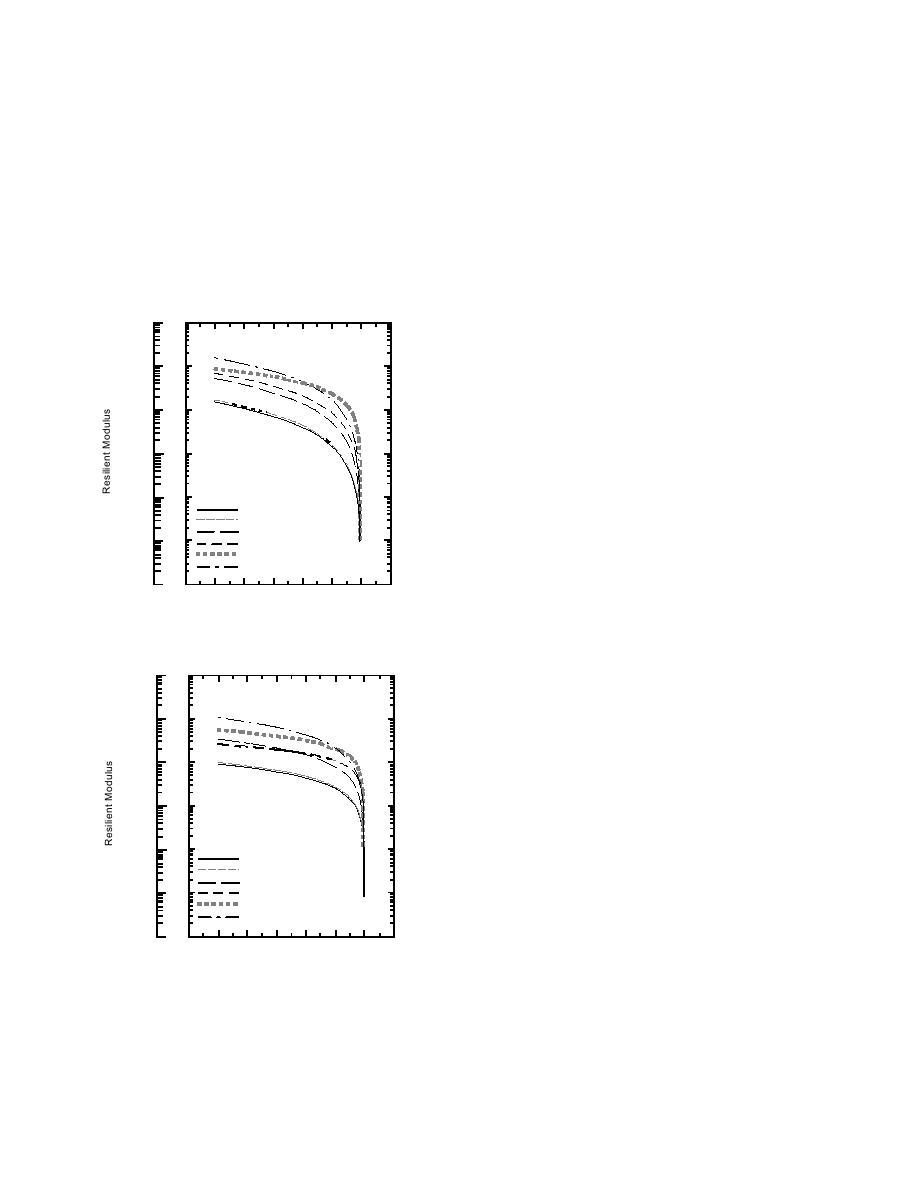
ing. Also shown is a line representing the pre-
binations applied (Table 3a). In the case of the
dicted moduli resulting from the equations given
1206 subgrade and the class 6 special base, it also
in Table 6, at the mean stress level tested. Where
relates to the variation in density. To show the
dry density is included in the equation, it was set
influence of density in the 1206 subgrade data,
at the average value of all specimens tested. It can
Figure 8 differentiates the data from three density
be seen in Figures 7a through 7f that moisture
ranges (high, medium, and low), along with the
level does influence the unfrozen moduli, but to
corresponding predicted resilient moduli lines.
different degrees, depending on the material.
Note that the low density moduli are most repre-
The vertical spread in the data points at a par-
sentative of moduli back-calculated from FWD
ticular degree of saturation (Fig. 7) is the result of
deflections measured on site at Mn/ROAD.
the materials response to the different stress com-
The effect of stress combinations is shown in
Figure 9 for the low-density 1206 subgrade data,
(lb/in.2 )
(kPa)
and all of the 1232 subgrade and class 3 special
8
7 x 10 8
10
subbase data. The two subgrades display an in-
verse relationship between modulus and deviator
stress; the class 3 special subbase has a propor-
tional relationship between modulus and the stress
6
7 x 10 6
parameter J2/τoct.
10
Figure 10 demonstrates the relative influence
of the deviator stress and confining pressure (σ3)
on the modulus of a single 1206 subgrade speci-
4
men at 16.1% water content. The deviator stress
7 x 10 4
10
1206
has the major influence, while confining pressure
1232
Class 3
produces only minor variations in the moduli. The
Class 4
figure also includes a line of predicted resilient
Class 5
Class 6
moduli based on a regression analysis of these
2
7 x 10 2
10
data alone, in the form:
-12
-10
-8
-6
-4
-2
0
2
Temperature (C)
Mr (lb/ft2) = K1 (σd)K2,
a. Governing parameter wug/wt.
as well as the upper and lower 95% confidence
(lb/in.2 )
(kPa)
interval around the mean line. The confidence band
108
7 x 10 8
brackets the variation in modulus related to σ3.
We generated several predicted curves for indi-
vidual samples as described above to isolate the
influence of moisture content and density, respec-
106
7 x 10 6
tively, on the resilient modulus of the 1206 sub-
grade material. Figure 11 shows the relationship
between modulus and deviator stress of specimens
with a similar density, but with different moisture
4
levels. It confirms the expected relationship that
7 x 10 4
10
1206
the drier sample exhibits a higher modulus at simi-
1232
Class 3
lar stress conditions. Figure 12 compares two
Class 4
samples with similar moisture, showing that the
Class 5
Class 6
higher density sample has higher moduli.
102
7 x 10 2
A comparison of the predicted modulus curves
-12
-10
-8
-6
-4
-2
0
2
Temperature (C)
generated by the equations in Table 6 for all the
b. Governing parameter wuv.
materials studied is given in Figure 13. Among
the curves of the base/subbase materials, there is a
Figure 6. Predicted frozen resilient modulus
general increase in the predicted moduli as the
for all Mn/ROAD materials.
14


 Previous Page
