(lb/in.2 )
(lb/in.2 )
(kPa)
(kPa)
106
7 x 10 5
105
7 x 10 6
5
5
10
7 x 10
7 x 10 4
4
10
4
7 x 10 4
10
Class 4 Subbase
1206 Subgrade
Albany Taxiway A Subbase
3
3
7 x 10 3
10
7 x 10 3
10
100
80
60
40
100
80
60
40
Degree of Saturation (%)
Degree of Saturation (%)
a. 1206 subgrade. (These data are probably in error--
d. Class 4 special subbase.
see text.)
(lb/in.2 )
(lb/in.2 )
(kPa)
(kPa)
6
7 x 10 6
7 x 10 5
105
10
5
5
7 x 10
10
7 x 10 4
4
4
7 x 10 4
10
10
3
7 x 10 3
10
Class 5 Subbase
1232 Subgrade
Dense Graded Stone
2
7 x 10 2
3
10
7 x 10 3
10
70
100
90
80
60
100
80
60
40
Degree of Saturation (%)
Degree of Saturation (%)
e. Class 5 special subbase.
b. 1232 subgrade.
(lb/in.2 )
2
(kPa)
(kPa)
(lb/in. )
7 x 10 6
106
7 x 10 5
105
Calc - Log Log
5
105
7 x 10
4
104
7 x 10
Calc - Semi Log
7 x 10 4
104
Class 6 Base
Class 3 Subbase
7 x 10 3
103
103
10 3
7x
100
80
60
40
20
0
100
80
60
20
40
Degree of Saturation (%)
Degree of Saturation (%)
c. Class 3 special subbase.
f. Class 6 special base.
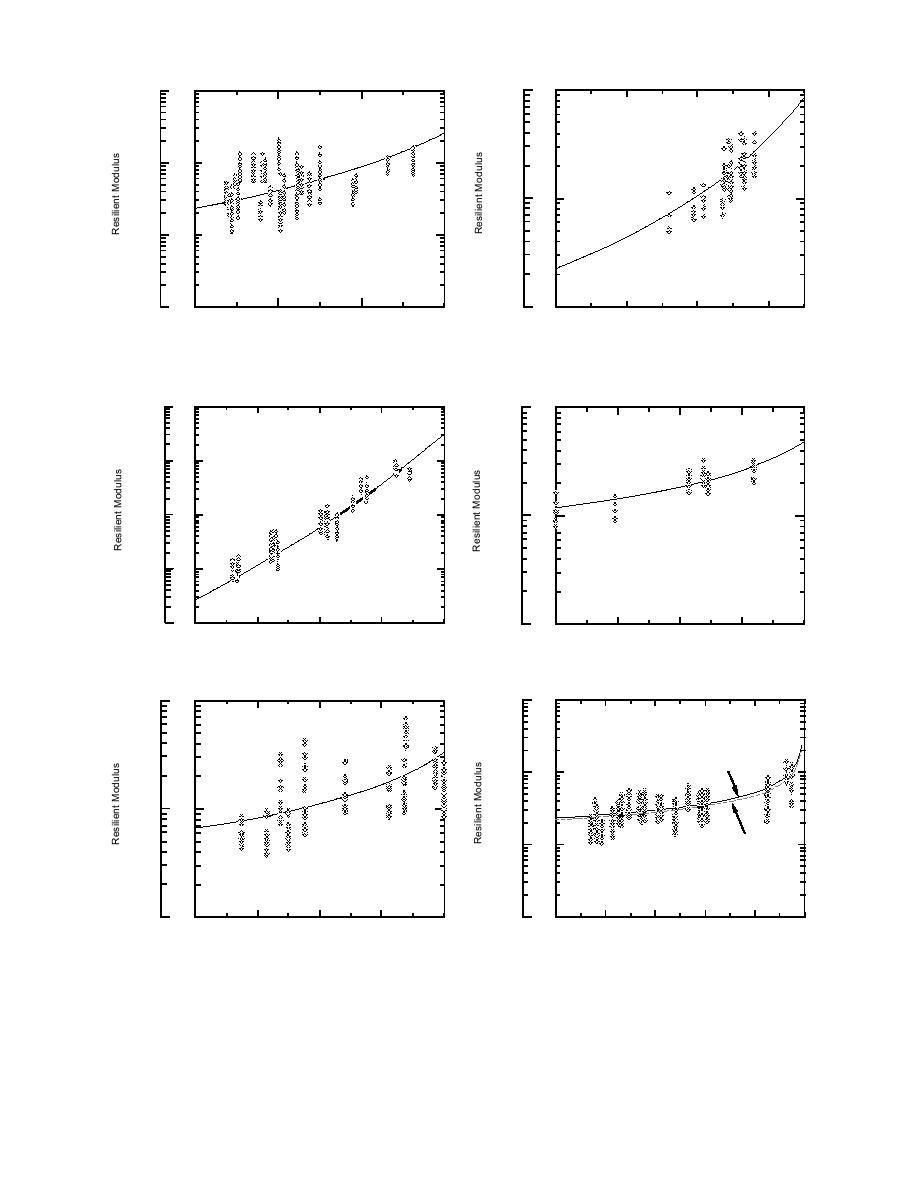
Figure 7. Resilient modulus vs. degree of saturation for never frozen subgrade materials and thawed base/
subbase materials. Solid line represents calculated value based on mean condition of stress (and density
where included).
15


 Previous Page
