(lb/in.2 )
(lb/in.2 )
(kPa)
(kPa)
6
106
7 x 10 6
7 x 10 6
10
1206 Unfrozen
3
115 lb/ft
7 x 10 5
5
105
5
108
7 x 10
10
105
Calculated σd (lb/in.2 )
4
7 x 10 4
104
7 x 10 4
10
Density (lb/ft 3)
0.5
1.0
High
114 - 117
4.0
107 - 110
Medium
10
104 - 106
Low
14
3
3
7 x 10 3
3
7 x 10
10
10
100
80
60
40
100
80
60
40
Degree of Saturation (%)
Degree of Saturation (%)
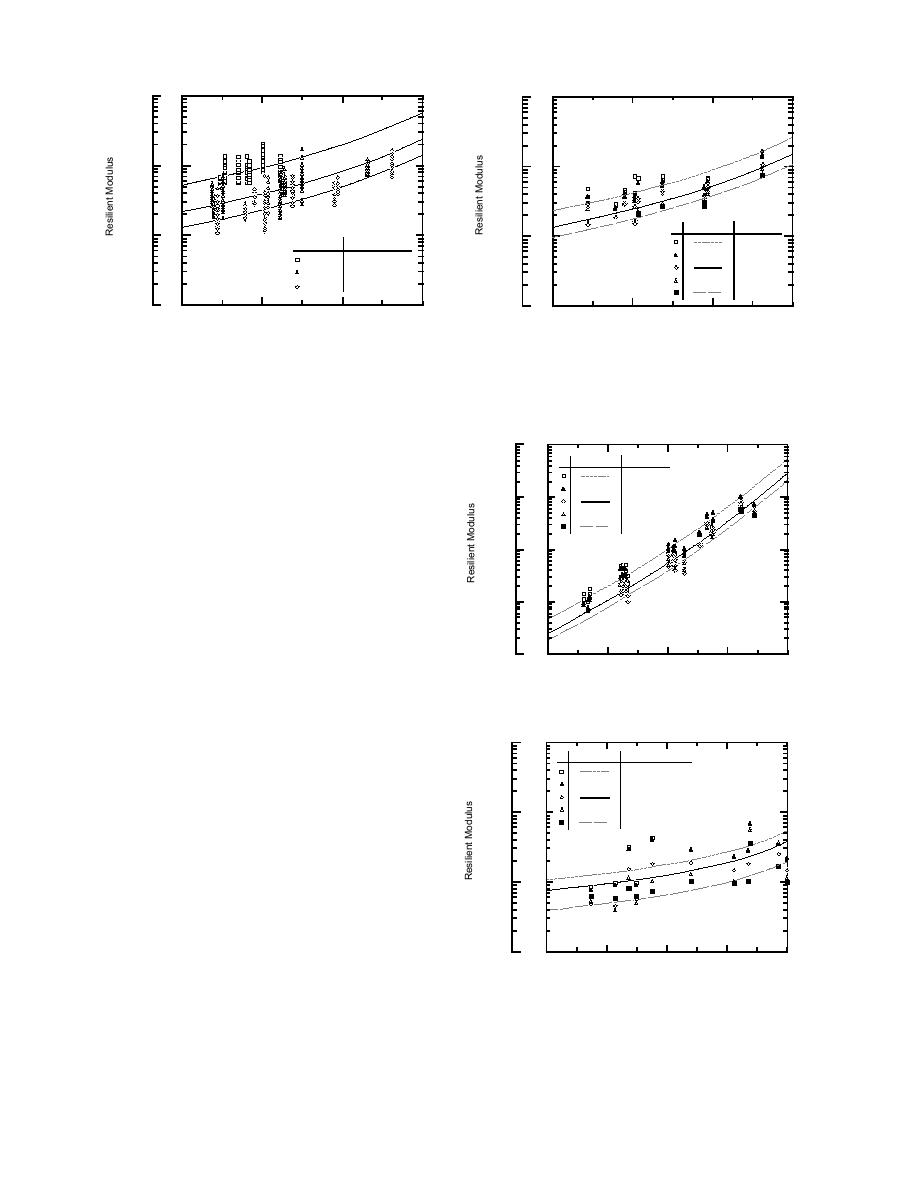
a. Low-density (1.661.7-Mg/m3 or 104106-lb/
Figure 8. Resilient modulus vs. degree of satura-
ft3) 1206 subgrade. (These data are probably in
tion of never-frozen 1206 subgrade material il-
lustrating the effect of dry density.
error--see text.)
(lb/in.2 )
(kPa)
amount of fines in the material decreases, with the
6
6
10
7 x 10
exception of the class 4 special material. There is
Calculated σd (lb/in.2 )
also a decrease in the slope of the predicted curves
0.5
1.0
with decreasing fine content, indicating the ex-
5
5
7 x 10
10
5.0
pected lesser influence of moisture content on the
9.0
14
moduli of the coarser materials. The curves of the
4
7 x 10 4
two clay subgrades depart somewhat from this
10
pattern. The curve for the 1232 subgrade has an
extremely steep slope, showing a much stronger
10 3
3
7 x 10
influence of the degree of saturation on the modu-
lus. The curve of predicted moduli for the 1206
1232 Unfrozen
subgrade is higher than those for the coarser
2
2
10
7 x 10
100
90
80
70
60
materials. Although this is contrary to conven-
Degree of Saturation (%)
tional rules-of-thumb, high moduli for cohesive
b. 1232 subgrade.
materials have also been reported by Robnet and
Thompson (1973). However, it is more likely that
(lb/in.2 )
(kPa)
6
7 x 10⁶
10
the high 1206 subgrade moduli are related to the
Calculated J 2 / τoct (lb/in.2 )
miscalibration of the testing machine. This possi-
640
bility is being investigated in more detail and find-
330
117
ings will be included in the Phase 2 report (Berg
5
5
58
7 x 10
10
in prep.).
5
For each material tested, Figure 14 shows the
frozen and thawed/unfrozen moduli data points
7 x 10⁴
104
and curves based on the regression equations re-
sulting from this analysis. Data in Figure 14 illus-
trate the rapid increase in modulus as the soils
Class 3 Subbase
freeze and a lower-magnitude increase in modu-
7 x 10³
103
lus values with decreasing saturation. To illustrate
100
80
60
40
20
Degree of Saturation (%)
these general trends, the calculated relationships
c. Class 3 special subbase.
vs. degree of saturation are also shown, for one
Figure 9. Resilient modulus vs. degree of satura-
stress condition only. As shown in Figure 9, stress
tion illustrating effect of stress parameters.
conditions also influence resilient modulus values.
16


 Previous Page
