6
4
2
0
5
4
3
2
1
0
30
Control
20
Test
Section
10
Leaves
0
9 Mar `94 11
13
15
17
19
21
23
25
27
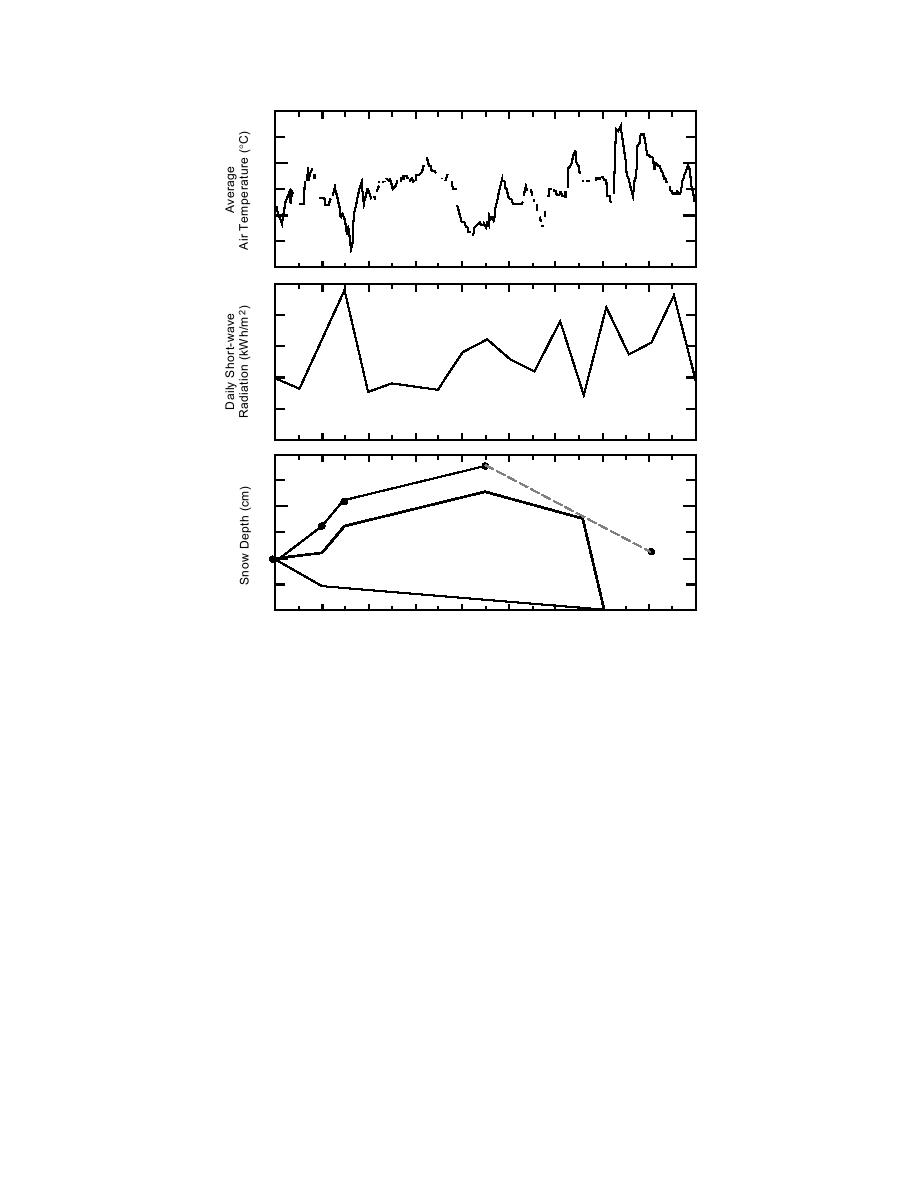
Figure 12. Meteorological conditions and snow cover depth during the field
tests on the Winooski River in Montpelier, Vermont.
was in the 80% range, or about 190 g/m2 by
shooting with the wind, the range increased to
weight. The area of coverage was about 2,800 m2.
about 43 m.
Only half of the 9,500 L slurry was used at this
site. The areal coverage was around 5080%, or
History of the ice decay
about 190 g/m2 by weight. The total area of cov-
The air temperature and estimated incident so-
erage was about 2,800 m2.
lar radiation during the test period are shown in
Figure 15. These data come from the Lebanon Re-
Hartford Village Bridge (Site D)
gional Airport, which was about 2 miles from the
At this site 11 bags of leaves were added to the
test sites. Also Figure 15 gives a plot of the ice thick-
4,800 L of slurry left over from the Bridge Street
ness for site C and snow cover for both sites dur-
Bridge. The hydroseeder was also refilled to its
ing the tests.
9,500-L capacity, so for this site we had a mixture
From Figure 15 we can see that leaves were ef-
of approximately 18 bags of leaves in the 9,500-L
fective in melting the snow and ice in the test sec-
slurry.
tions. The average ice thickness in the test reach is
This bridge is about 15 m above the ice; thus
about 35 cm thinner in the test reach than in the
we were able to get far better range with the 1-in.
control after 13 days. This represents a lost in ice
nozzle previously used. As a result we used the 1-
thickness of about 0.30.4 cm/day. We note that
in. nozzle to spread the leaves farther away from
the 6 cm of snow that was deposited on the ice on
the bridge and the flared nozzle to deliver the
the 22nd was melted off the test section the fol-
leaves closer to the bridge. The areal coverage here
lowing day. However, in the control section the
10


 Previous Page
