Marker
Initial
Ice surface
Amount of Melt
New Ice Surface
13 cm
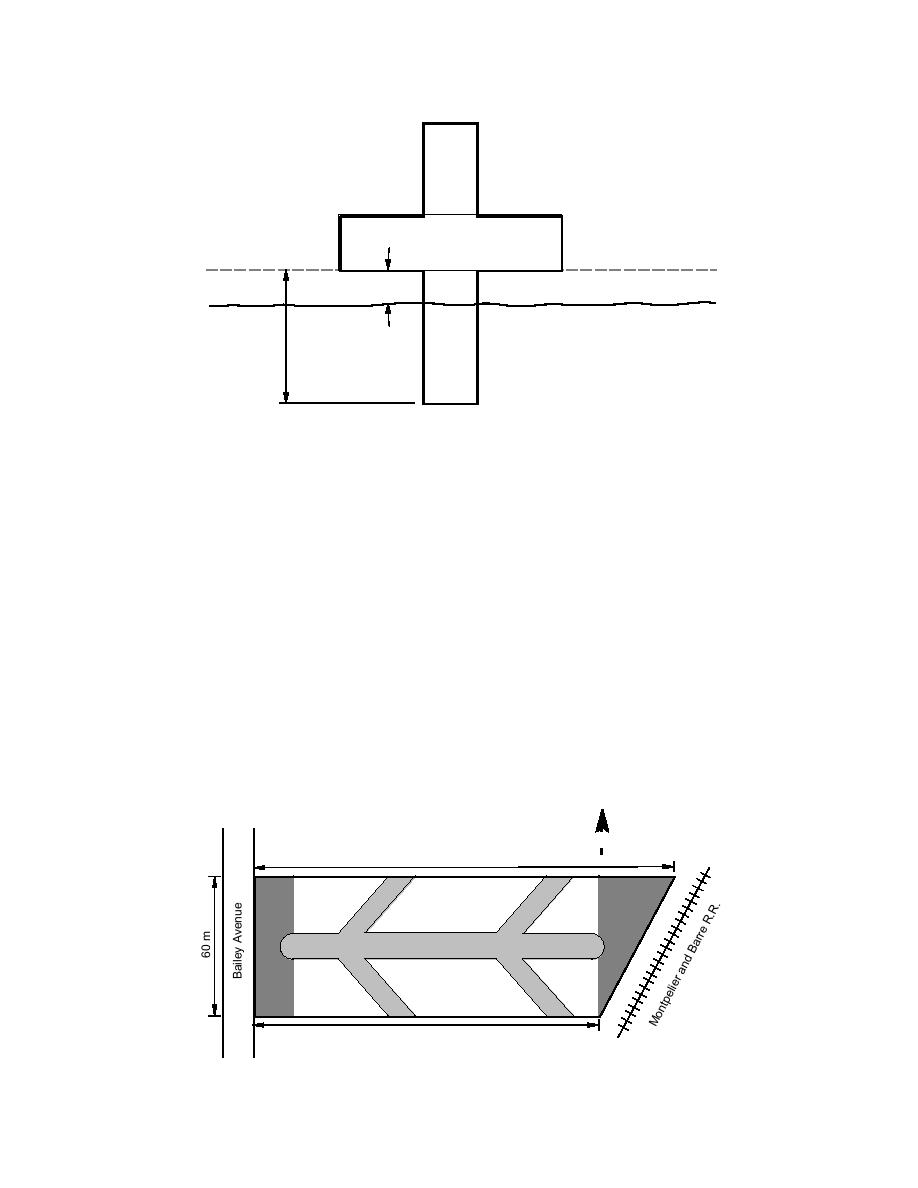
Figure 9. Schematic of stakes used to locate leaves and document ice depletion.
across the river at the railroad bridge (Fig. 11 shows
pieces would easily wash out with the spring run-
the cannon in use). At both of these locations the
off. The chevrons (Fig. 10) were oriented to try to
hydroseeder was about 4.5 m above the ice sur-
channel surface runoff from the adjacent parking
face. The spray from the hydroseeder projected out
lots out to the middle of the ice cover, thereby ac-
about 40 m across the ice. The area covered using
celerating the ice decay.
the cannon was approximately 3,200 m2. It took
roughly 10 minutes to cover this area. Thus the
Interstate 89 (Site B)
total area covered using both the hose and can-
We spread 9,500 L of slurry at this site from
non was almost 8000 m2 (the total river area in
Route 2 using the hydroseeder's cannon. We cov-
this reach was 13,200 m2). The areal coverage was
ered 0.5 km of the river between I-89 and cem-
about 30%; there was approximately 70 g of mate-
etery bend in about 20 minutes. The total area of
coverage was again about 8,000 m2. The density
rial per square meter.
The dusting pattern shown in Figure 10 was
of coverage was about the same as at the Bailey
chosen in an attempt to weaken the ice cover us-
Avenue Bridge.
ing a minimum amount of mulch. Rather than melt
all of the ice, the rationale was to melt break lines
History of the ice decay
into the ice for it to fail along. Then these smaller
The initial thickness of the ice at site A and B
N
275 m
Spread
w/Cannon
Spread
with Hose
215 m
Figure 10. Detail of dusting at site A in Montpelier, Vermont.
8


 Previous Page
