10
8
Unacidified
Control
6
4
pH 3.5
2
pH 2.0
0
20
40
Storage Time (days)
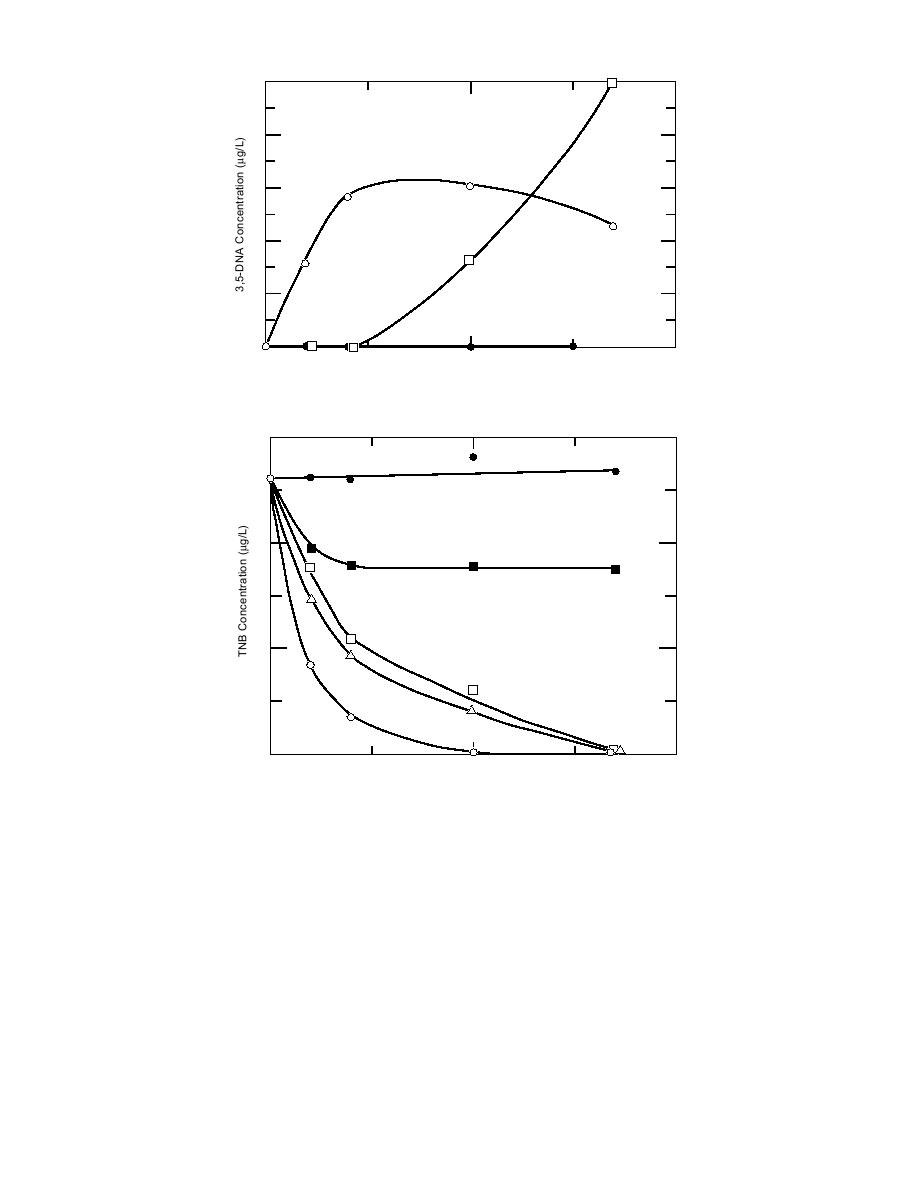
Figure 2. Concentration of 3,5-DNA for samples acidified to pH 2, pH 3.5,
and left unacidified.
30
7.5% ACN
20
5.0%
10
1.0%
0.1%
Control (0%)
0
20
40
Storage Time (days)
Figure 3. Stability of TNB as a function of the acetonitrile concentration
for unacidified samples.
vation depended on the ACN concentration used.
at day 20 and probably indicates that acidification
For concentrations at or below 5.0%, increasing
to pH 3.5 is having a greater effect on the destruc-
losses of TNB were found as a function of storage
tive mechanism for 3,5-DNA than on the mecha-
time (Fig. 3). For all of these samples, the loss of
nism of production. Acidification to pH 2 with
TNB was accompanied by an increase in the con-
sodium bisulfate, however, was very effective in
centration of 3,5-DNA. For ACN concentrations
preserving the TNB concentration over the entire
below 5.0%, the rate of loss of TNB was inversely
30-day period (Fig. 1), and no detectable concen-
related to ACN concentration. The fastest rate of
tration of 3,5-DNA was observed. The small in-
loss was observed for the control (no addition of
crease in TNB concentration with time is attrib-
ACN). No loss of TNB, or observable 3,5-DNA,
uted to day-to-day calibration error.
were found for samples containing concentrations
The effects of the addition of ACN for preser-
6


 Previous Page
