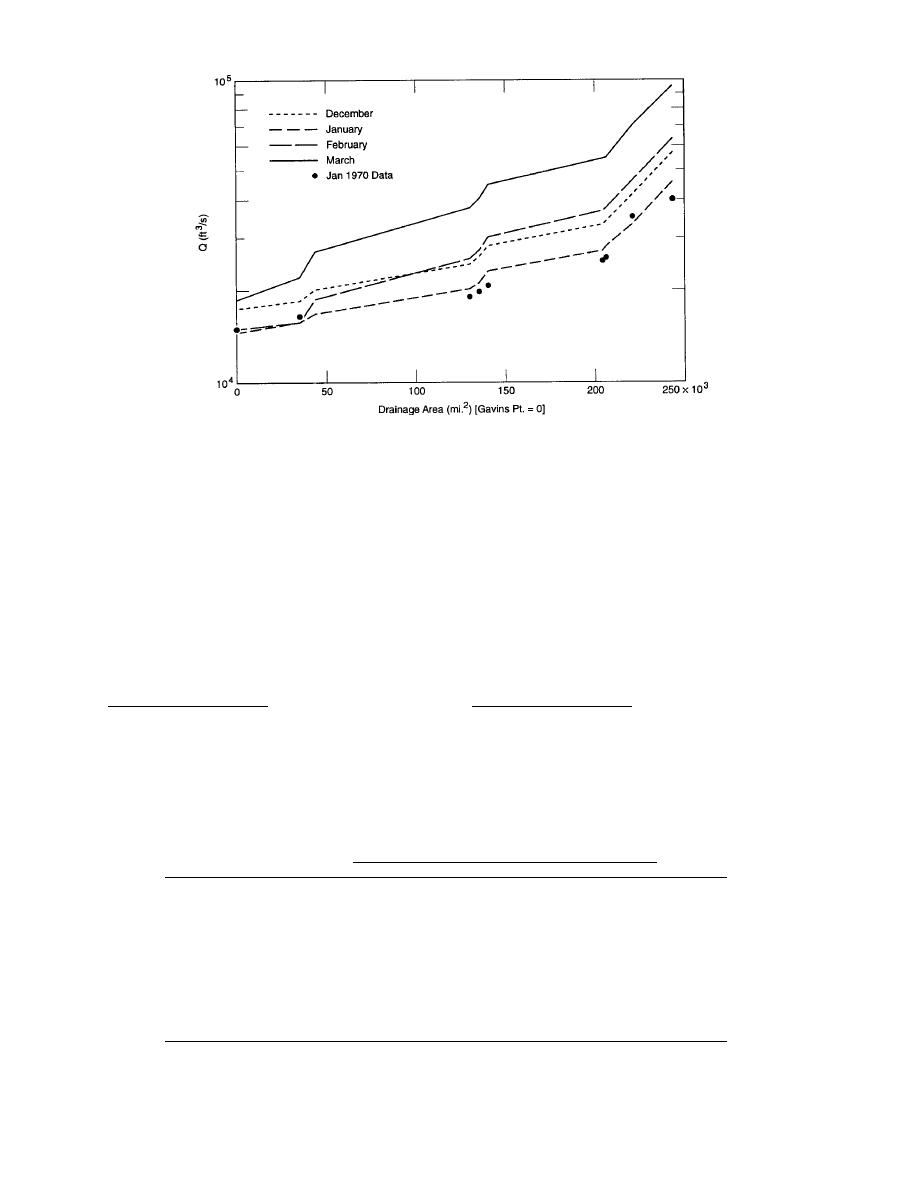
Figure 20. Mean monthly discharge distributions.
Table 8 has been subtracted from the discharges at
mates of the minimum stage necessary for normal
the other stations. Any planned release would then
intake operation and the critical stage at which the
simply be added to the values for the applicable
intake would be effectively shut down. The water
month in Table 9 to find a representative flow distri-
surface elevation information obtained in this sur-
bution along the river.
vey, presented in Table 10, was used as the basis for
estimating the discharge magnitudes necessary for
water intake operations.
Minimum flow requirements
To estimate flows necessary to ensure adequate
To estimate the discharge distributions required
water surface elevations at municipal and industrial
to satisfy water users along the river, the informa-
(M&I) water intakes along the river, MRD personnel
tion in Table 10 was compared with the results of a
conducted a survey of all known intakes.* Among
water surface profile analysis by MRD personnel†
the information solicited in this survey were esti-
using the HEC-2 computer program (USACE 1990).
†
* W. Stern, CEMRD-ED-TH, 1991, personal communica-
A. Swoboda, CEMRD-ED-TH, 1991, personal commu-
tion; minimum flow requirements for water supply, sur-
nication; verified HEC-2 Water Surface Profile data deck
and associated analysis conducted in conjunction with
vey and associated analysis conducted in conjunction
Missouri River Master Water Control Manual Review
with Missouri River Master Water Control Manual Re-
and Update--Phase 2.
view and Update--Phase 2.
Table 9. Mean monthly incremental discharge distributions.
Discharge (ft3/s), mean of means
Q (ft3/s)
River
Station
mile
December
January
February
March
Jan 70
Yankton
805
0
0
0
0
0
Sioux City
732
900
600
1,100
3,400
1,500
Omaha
616
2,500
1,700
4,100
8,300
2,000
Nebraska City
562.6
7,000
5,200
10,900
18,900
4,000
Rulo
498
8,500
6,300
12,500
22,100
4,700
St. Joseph
448
10,700
8,100
15,400
26,400
5,750
Kansas City
366.1
15,700
12,000
21,900
35,925
10,000
Waverly
293.5
16,600
12,900
23,000
36,400
10,500
Booneville
196.6
23,500
18,200
31,900
50,900
19,800
Hermann
97.9
40,600
31,400
50,000
77,400
25,000
18


 Previous Page
