14 x 103
12 x 103
12
1%
10
10
8
8
5%
6
6
10%
4
4
2
20%
2
0
50%
2
5 10 20
100
0
Return Interval in Years
1 Dec
15 Dec
1 Jan
15 Jan
1 Feb
15 Feb
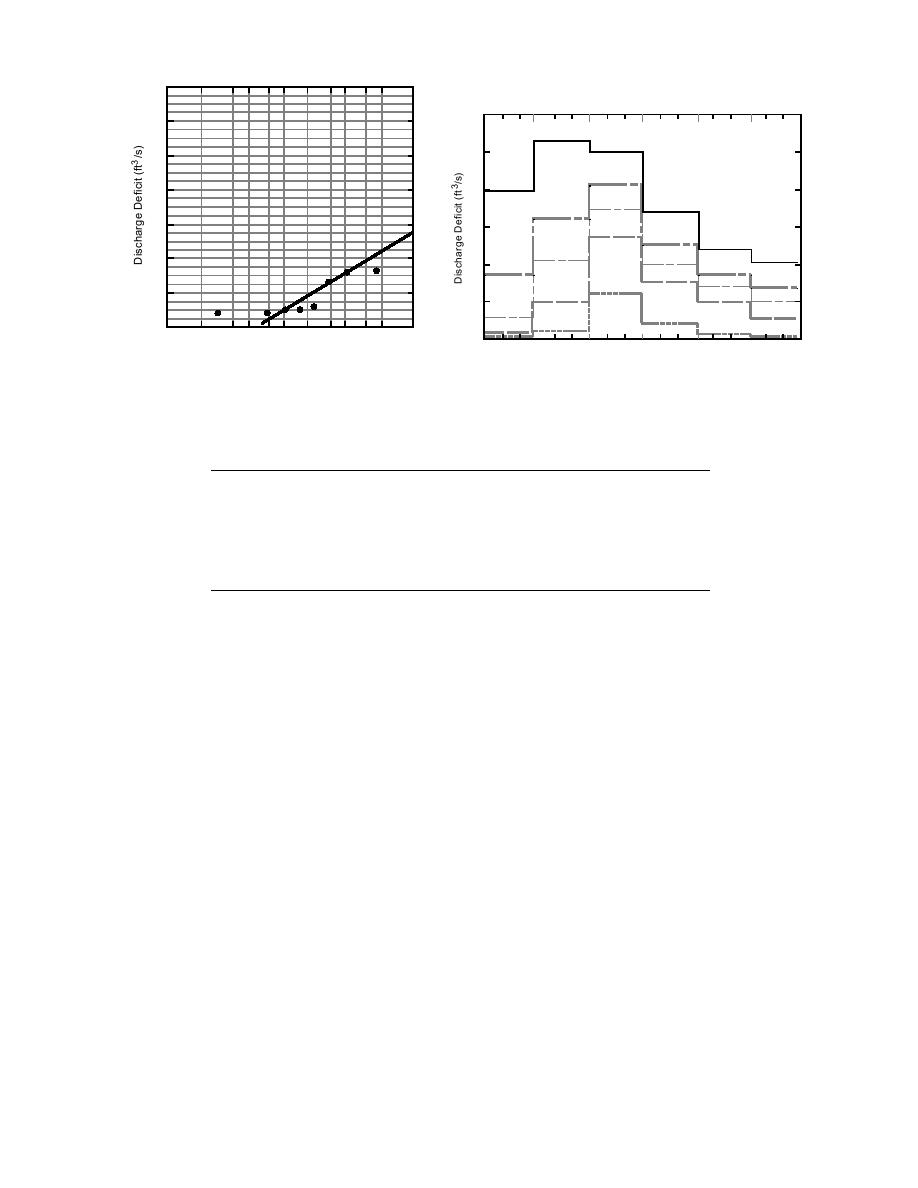
Figure 14. 1 15 February probabilities.
Figure 15. Probability of discharge deficit by time period.
Table 6. Discharge deficit by half-month periods, winter 197071 through 198788.
115 Dec 1631 Dec 115 Jan
1631 Jan 115 Feb 1628 Feb
Years with ice-impacted
4
11
10
11
8
4
period
Total ice-impacted periods
5
15
17
17
13
5
Percentage of years with
22
61
55
61
44
22
ice-impacted period
Years in which annual
2
3
7
3
1
1
maximum occurred
a mixed population, and separate probability curves
22%, the percentage of years in which a discharge
have been drawn to indicate the two populations. At
deficit occurred during the period 1628 February.
this time it is not possible to explain the mixed-
population appearance of this data.
Statistical analysis of
To complete the statistical analysis, we must take
ice-impacted discharges by
note that discharge deficit cannot be expected during
accumulated freezing-degree-days
each half-month period every winter as shown in
The number of freezing-degree-days for any day
Table 6. We can find the conditional probability by
is defined by difference in the average daily air
temperature and 0C (32F). For example, if the daily
multiplying the percentage of years in which an ice-
average air temperature is 10C (14F), this would
impacted period occurred by the exceedance proba-
translate into 10 freezing-degree-days (C-day) for
bilities associated with the return intervals shown in
Figures 11 through 14. These conditional probabili-
that day. We can characterize a winter by the number
ties define the risk of a particular ice-impacted dis-
of freezing-degree-days that are accumulated dur-
charge deficit being exceeded in any year. The results
ing the winter. In this study, we accumulate the
are shown in Figure 15. To determine the conditional
freezing-degree-days starting on 1 December. There-
probabilities for the period 115 December, the
fore, we can define the accumulated freezing-de-
excedance probabilities in Figure 11 (1631 Dec)
gree-days (AFDD) on any day as the number of
were used, but these probabilities were multiplied
freezing-degree-days accumulated between 1 De-
by 22%, the percentage of years in which a discharge
cember and that day. A plot of the exceedance prob-
deficit occurred during the period 115 December.
abilities of AFDD for Yankton, S.D., is shown in
To determine the conditional probabilities for the
Figure 16. The probabilities are shown for the dates
period 1628 February, the probabilities in Figure 14
1 December, 15 December, 1 January, 15 January, 1
(115 Feb) were used, but they were multiplied by
February, and 15 February.
14


 Previous Page
