30 10 3
I
Reach Minimum
ntake Minimum
20
10
0
0
200
400
600
800
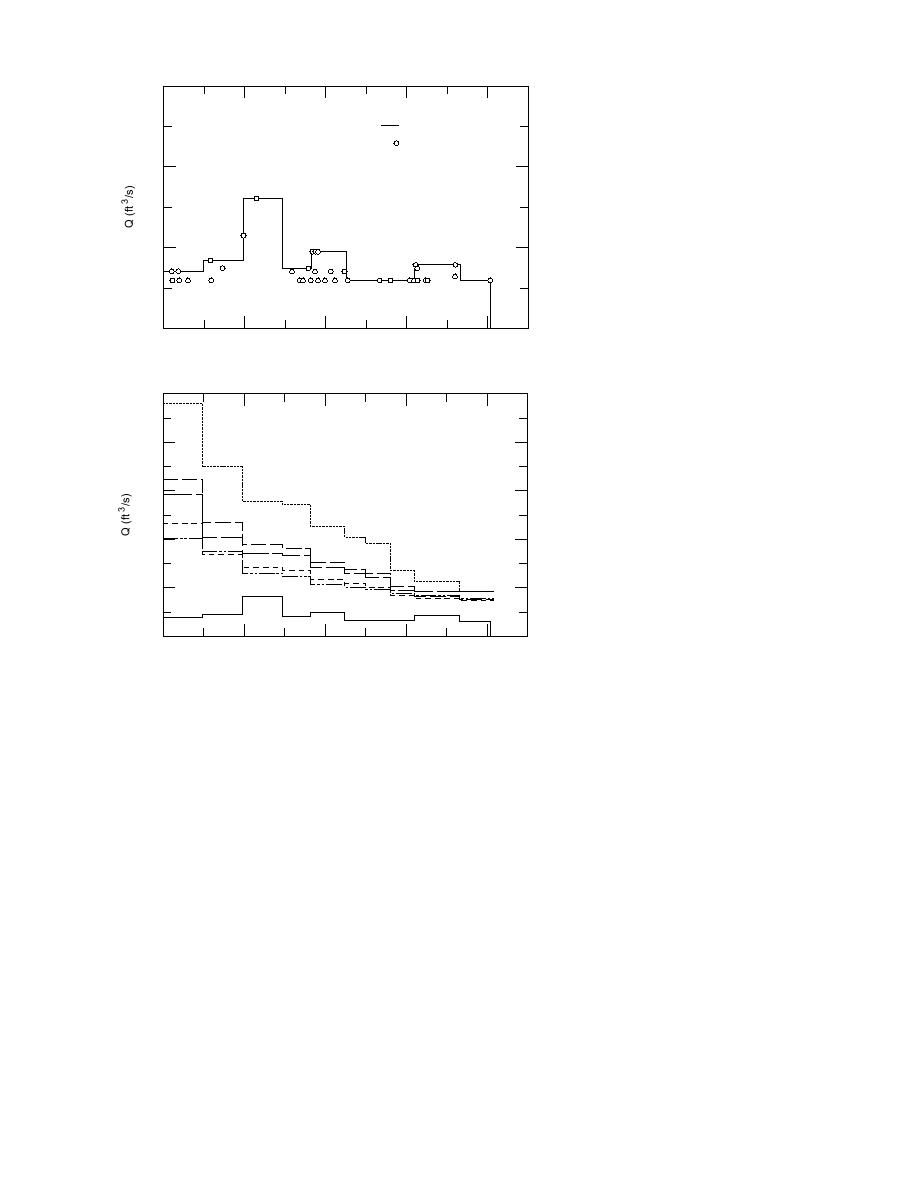
Figure 21. Minimum required dis-
River Mile
charges for water supply.
100 10 3
Mar
80
Jan
60
Dec
Feb
40
Jan '70
20 R M & I
equirement
0
Figure 22. Mean monthly minimum flow
0
200
400
600
800
requirements.
River Mile
long-term average minimum release from the dam to
Comparison of
meet the specified minimum discharge distribution
baseline flows with
along the river. In Table 11 these minimum excess
minimum flow requirements
discharges have been subtracted from all corre-
Figure 22 presents a comparison of the long-
sponding monthly mean excess discharge values to
term, monthly mean discharges with the reach-
give not only the minimum release from Gavins
based minimum flow requirements determined
Point but also the distribution of flow in excess of
above. Subtracting these minimum flow require-
that required for water supply at all gaging stations
ments from the monthly mean discharges provides
along the river for the case of tributary inflows equal
the long-term average discharge in excess of that
to their long-term averages.
required for water supply shown in Figure 23. In this
In the Missouri River Master Water Control
figure, it can be seen that river reaches closest to
Manual Review and Update (USACE 1990), under
falling below the minimum required stages are typi-
the section on baseline for plan comparison, it is
cally between river miles 616 to 806. Further, January
stated that "...the minimum release considered to
is clearly the month of greatest concern from a purely
be applicable at this time is 6,000 cfs. Even though
open water hydraulic standpoint, followed by De-
higher releases are currently required to provide
cember and February.
If we subtract the minimum excess discharge for
water at the intakes downstream from the main
stem system, the minimum nonnavigation release
each month shown in Figure 23 from the long-term
baseline will continue to be 6,000 cfs."
monthly mean release at Gavins Point, the result is a
20


 Previous Page
