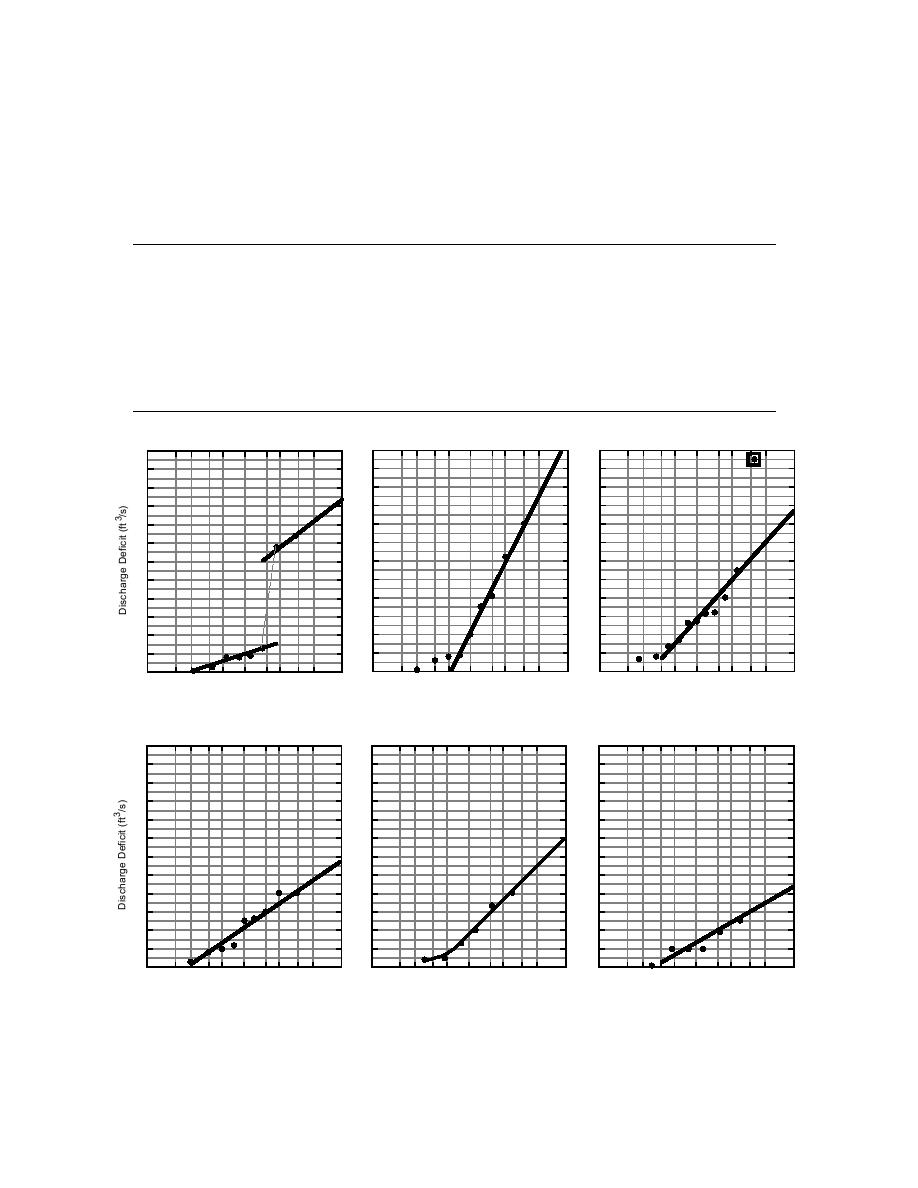
pected during each AFDD category every winter as
associated with the return intervals in Figure 18.
shown in Table 7. We can find the conditional prob-
These new probabilities define the risk of a particular
ability of exceedance by multiplying the percentage
ice-impacted discharge deficit being exceeded in any
of times that ice-impacted periods occurred during
year in which that AFDD category is reached. The
the AFDD category by the exceedance probabilities
results are shown in Figure 19.
Table 7. Discharge deficit by AFDD periods, winter 197071 through 198788.
0100
101200
201300
301400
401500
501600
601700
>700
Years in which AFDD
18
18
17
16
15
13
9
5
category reached
Years with ice-impacted
4
8
9
11
9
6
6
2
period
Total ice-impacted
4
14
9
16
12
7
7
3
periods
Percentage of years in
22
44
53
69
60
46
66
40
which impacted period
occurred during AFDD
period.
3
3
12 x 10 3
10
8
6
4
2
0
2
5 10 20
100
2
5 10 20
100
2
5 10 20
100
Return Interval in Years
Return Interval in Years
Return Interval in Years
a. 101200 AFDD.
b. 201300 AFDD.
c. 301400 AFDD.
3
12 x 10 3
10
8
6
4
2
0
2
5 10 20
100
2
5 10 20
100
2
5 10 20
100
Return Interval in Years
Return Interval in Years
Return Interval in Years
d. 401500 AFDD.
e. 501600 AFDD.
f. 601700 AFDD.
Figure 18. Accumulated freezing-degree-day probabilities.
16


 Previous Page
