Table 11. Monthly minimum release flow distributions.
River
Qmin M&I
Minimum monthly flow distributions
Station
mile
(reach)
Dec
Jan
Feb
Mar
Gavins Point
811
7,100
7,400
6,900
6,000
Yankton
805
7,100
1,400
900
0
6,000
Sioux City
732
0
0
0
1,400
6,000
Omaha
616
3,600
3,100
5,000
8,300
8,000
Nebraska City
562.6
8,100
6,600
11,800
18,900
6,000
Rulo
498
9,600
7,700
13,400
22,100
6,000
St. Joseph
448
8,300
6,000
12,800
22,900
6,000
Kansas City
366
15,300
11,900
21,300
34,425
9,500
Waverly
293.5
7,700
4,300
13,900
26,400
7,500
Booneville
196.6
22,100
17,100
30,300
48,400
16,000
Hermann
97.9
40,700
31,800
56,900
76,400
8,500
St. Louis
0
40,700
31,800
56,900
76,400
7,000
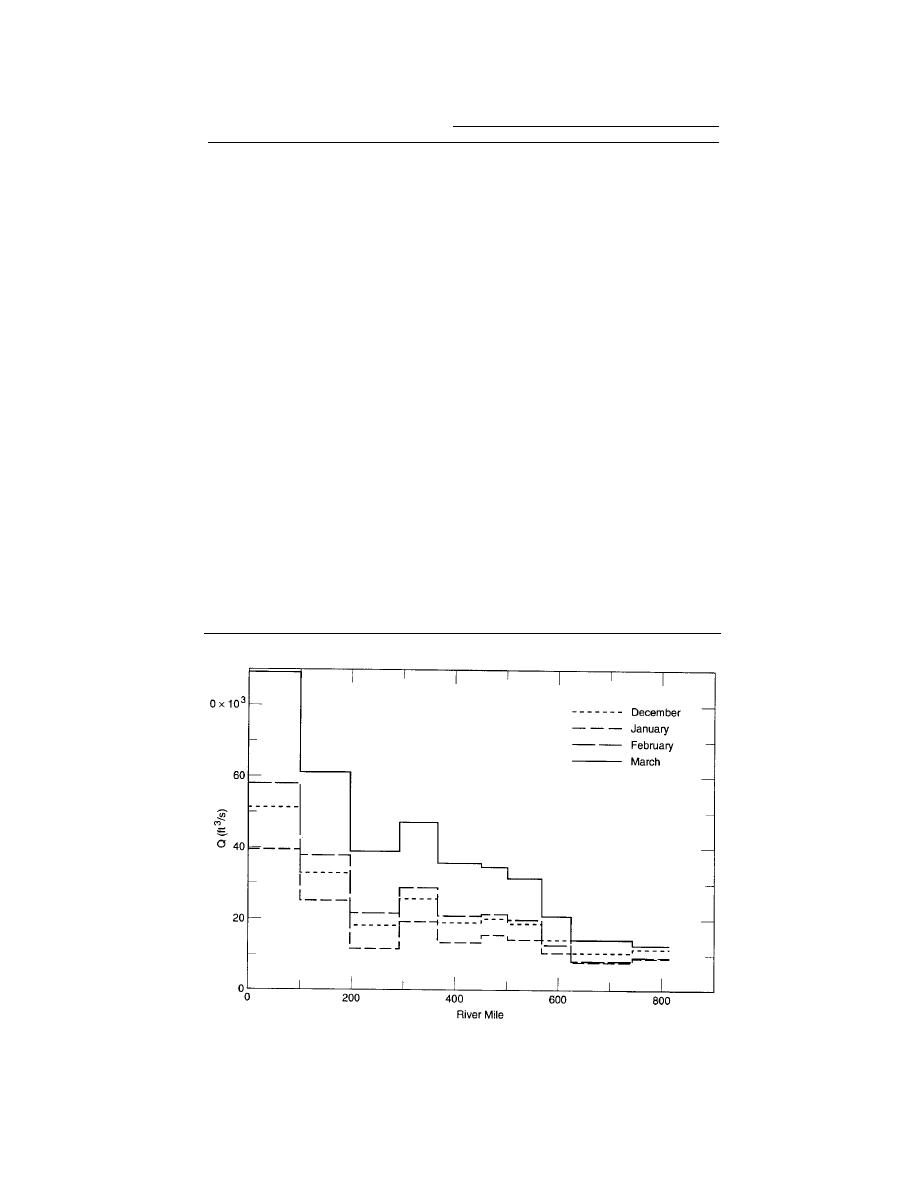
Figure 23. Excess mean monthly discharge.
21


 Previous Page
