Some scatter is evident in Figure 3.3. All points where the difference between the
measured and calculated downwelling fluxes was greater than 50 W/m2 were investigated.
Fifty-two points out of 932 points fell in this category. In every case, the measured flux
was greater than the calculated. In 13 of these cases, the observer reported frost on the
dome of the instrument during the morning inspection of the meteorological instruments.
Of the 39 remaining cases, 24 occurred during periods of reduced visibility (fog or haze)
and clear or scattered-cloud sky conditions. During periods of reduced visibility the
sensor does not "see" the cold sky, but some temperature associated with the low
atmosphere. The infrared model will not handle periods of reduced visibility effectively.
Only two cases occurred during the day with no obscuration to the visibility and when an
observer was on duty to take cloud observations. The average flux values for clear,
scattered (0.1 to 0.5 cloud cover), broken (0.6 to 0.9 cloud cover), and overcast (1.0 cloud
cover) are given in Table 3.2.1.
Table 3.2.1 Grayling I average downwelling IR flux for different cloud conditions.
Cloud amount
Measured IR
Calculated IR
clear
284.6
257.3
Scattered (0.1 to 0.5 cloud cover)
293.3
282.3
Broken (0.5 to 0.9 cloud cover)
331.9
336.3
Overcast (1.0 Cloud cover)
349.8
359.2
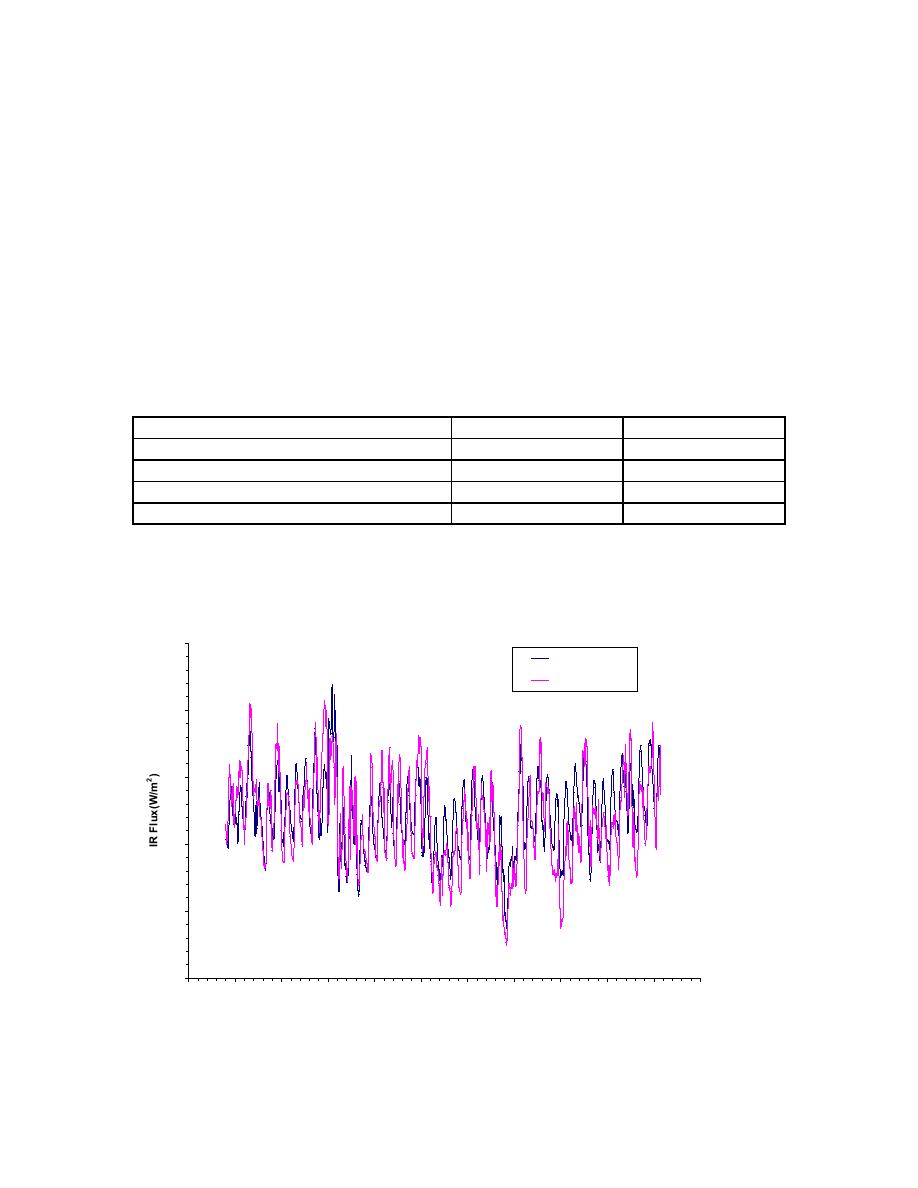
A similar analysis of the Yuma data is presented in Figures 3.4 and 3.5.
Yuma Downwelling Infrared Flux Comparison
450
Measured IR
Calculated IR
400
350
300
250
200
70
75
80
85
90
95
100
105
110
115
120
125
Fractional Day of the Year
Figure 3.4 Comparison of the downwelling measured and computed longwave flux based
on the Yuma meteorological observations.
20


 Previous Page
