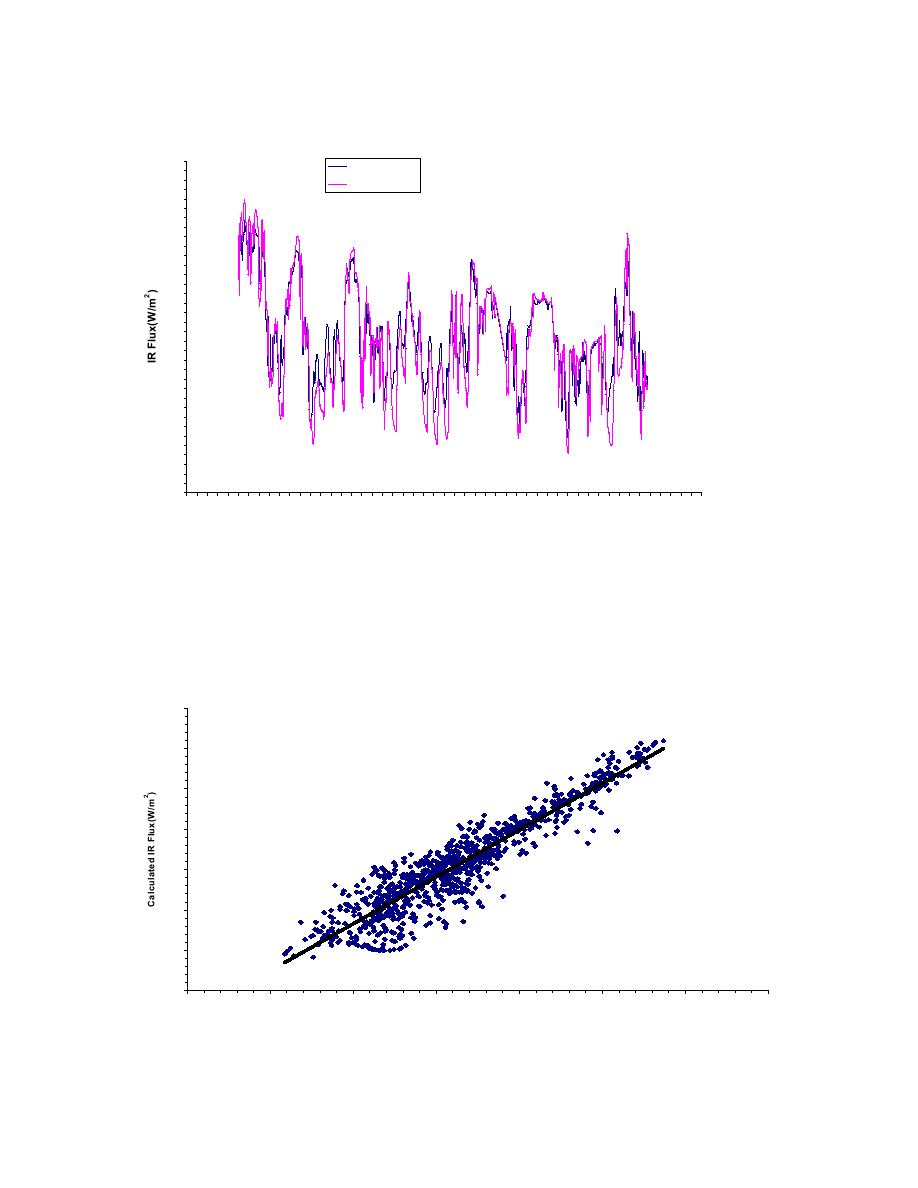
Grayling I Downwelling IR Flux Comparison
500
Measured IR
Calculated IR
450
400
350
300
250
200
150
255
260
265
270
275
280
285
290
295
300
305
Fractional DOY
Figure 3.2 Comparison of the downwelling measured and computed longwave flux based
on the Grayling I meteorological observations.
The comparison can also be presented as a scatter diagram (Figure 3.3). Also is the linear
least square fit and the R2 coefficient.
G ra y lin I D o w n w e llin g IR F lu x C o m p a ris o n
500
y = 1 .1 5 9 9 x - 5 6 .8 0 1
2
450
R = 0 .8 6 5 5
400
350
300
250
200
150
150
200
250
300
350
400
450
500
2
M e as ure d IR Flu x(W /m )
Figure 3.3 Comparison of the measured and model calculated downwelling longwave
flux.
19


 Previous Page
