GrayrangnIg Dowwnwelling Inffrrared Flx x omparisoison
G li yli I II Dp nwel i ng n ared Flu uC Comparn
450
y = 1.0831x - 17.479
2
R = 0.8345
400
350
300
250
200
150
100
100
150
200
250
300
350
400
Measured IR(W/m2)
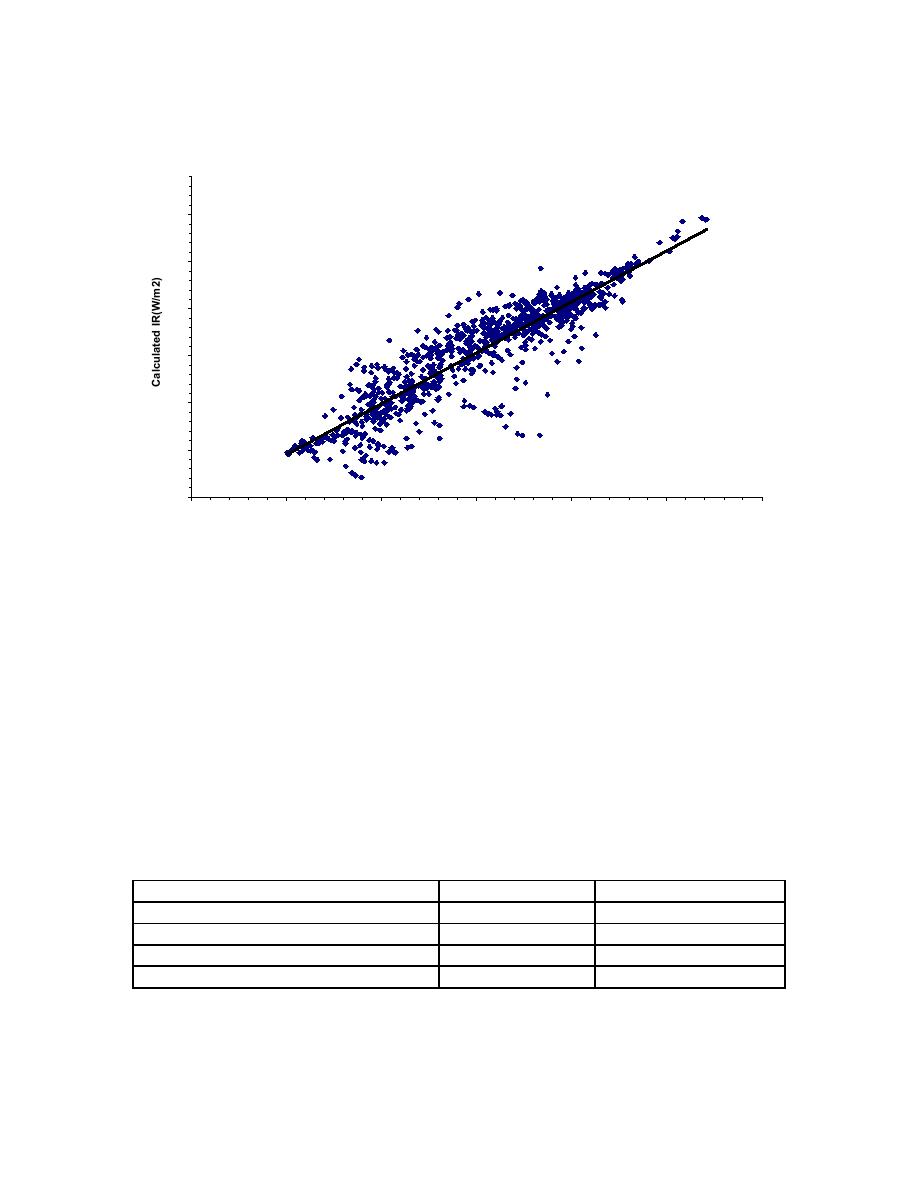
Figure 3.7 Comparison of the measured and model calculated downwelling longwave
flux.
Four percent (49 out of 1024) of the calculated flux values differed by more than 50 W/m2
from the corresponding measured values. In 25 of the 49 cases, either ice/snow was
reported on the dome of the instrument or fog with visibilities on the order of 2 km was
reported. R2 increases to 0.89 if these cases are removed from the database. As indicated,
the model can not handle the impact of fog on the downwelling infrared flux. In addition,
surface temperatures on the order of 20 C were reported in seventeen of the com-
parisons. It is doubtful that the model will predict the correct cloud base temperature,
especially the cloud base temperature of low clouds, under these conditions. Usually, in a
winter environment when the surface temperature is very low, there is a strong inversion.
Not only will the calculation of the cloud base temperature be affected by the presence of
an inversion, but the calculation of the atmospheric emissivity will also be affected.
Table 3.2.3 Grayling II average downwelling IR flux for different cloud conditions.
Cloud amount
Measured IR
Calculated IR
clear
203.9
182.1
scattered (0.1 to 0.5 cloud cover)
222.1
225.0
broken (0.5 to 0.9 cloud cover)
257.5
269.9
overcast (1.0 Cloud cover)
289.2
301.5
23


 Previous Page
