160
140
120
100
80
60
40
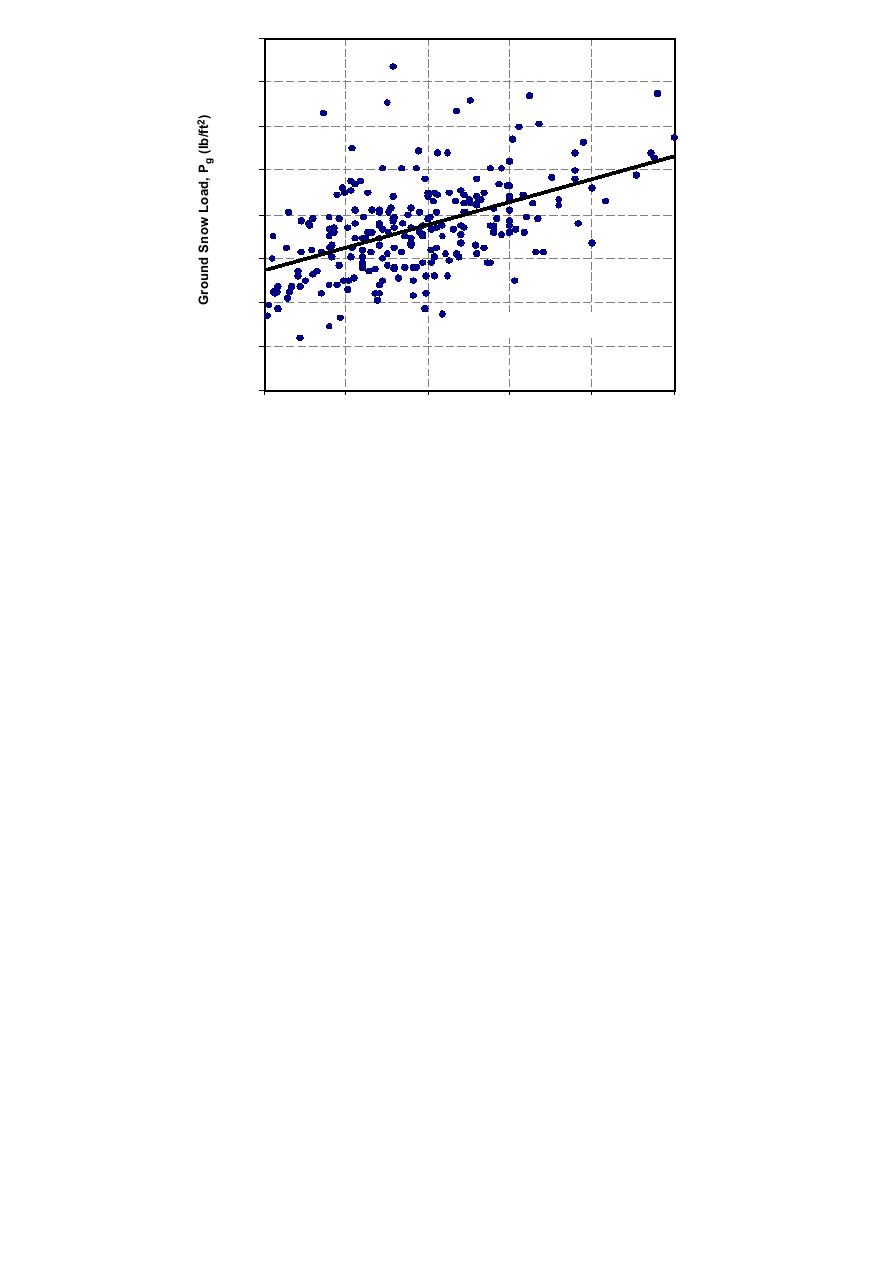
Slope = 2.1 lb/ft2 per 100 ft
20
0
0
500
1000
1500
2000
2500
Elevation (feet)
Figure 6. The elevation correction factor for the 236 highest quality stations used in
our analyses was 2.1 lb/ft2 per 100 ft (0.33 kN/m2 per 100 m). (To convert lb/ft2 to
kN/m2, mulitply by 0.0479, and for ft to m, multiply by 0.3048.)
process we developed to arrive at answers tended to
When several points at about the elevation of interest
fell above the trend line, he increased his preliminary
bring each of us to about the same answer. We expect
that if any one of us had used our method of analysis
answer.
alone, without receiving feedback from the others along
The other two SENH structural engineers consid-
the way, we may have arrived at significantly differ-
ered both NWS and non-NWS data, but one of them
ent answers for some towns. Thus, we conclude that
gave more weight to the non-NWS information be-
there is merit in involving several individuals in a way
cause it eliminated the step of having to relate snow
that they periodically receive anonymous feedback
depths to snow loads (see equation 1 in Tobiasson &
from each other. This process allowed the group to
Greatorex 1997). Both of these individuals developed
determine most answers before our meetings and pre-
selection criteria that eliminated from consideration a
cluded the need to discuss many of the case studies at
number of the stations on the case study form. The
those meetings. When we met, we concentrated on the
acceptance criteria of one individual were (1) at least
few case studies on which we had remaining concerns
15 years of record, (2) less than 15 (sometimes 20)
or disagreements. This left time for us to explore ways
miles (24, sometimes 32 km) away and (3) Pg/Pmax
of improving the process, ways of simplifying our find-
ratio no more than 1.75 for non-NWS stations and no
ings, and ways of incorporating them into the national
more than 1.5 for NWS stations. The other individual's
standard (i.e., ASCE 7-95) and into practice within
acceptance criteria were (1) at least 20 years of record,
New Hampshire. It also allowed us time to discuss our
(2) less than 15 miles away, and (3) Pg/Pmax ratio no
increasing understanding of ground snow loads in New
more than 1.5. Both then adjusted each selected ground
Hampshire.
snow load to the case study elevation by using an el-
evation correction factor of from 2.0 to 2.5 lb/ft2 per
100 ft of elevation difference (0.31 to 0.39 kN/m2 per
5 ADDITIONAL INVESTIGATIONS
100 m). Both then determined the average value of
For 69 of the 302 stations shown in Figure 2, where a
the ground snow load at that elevation for all the sta-
50-year ground snow load is available, the Pg/Pmax ratio
tions selected. In the vicinity of Mt. Washington, where
exceeded 1.5. Often, the 50-year ground snow load at
a station or two had a value quite different from this
average, a second average was often calculated, elimi-
such stations greatly exceeded other ground snow loads
in the vicinity. For example, the upper outlier in the
nating the outliers. One individual developed separate
lower plot in Figure 4 has a high Pg/Pmax ratio of 1.7.
averages for all data and for "non-NWS" data and gave
more weight to the "non-NWS" average. He always
Responding to this complication proved to be the
most controversial aspect of our analysis. To better
plotted all the data he analyzed and frequently referred
understand what was happening, we examined prob-
back to the case study plots before finalizing his answer.
A review of each individual's final answers indi-
ability plots of several of these stations and determined
that, for them, the log-normal distribution used
cates that no one's approach caused them to be consis-
to generate the ground snow load values on the case
tently much lower or much higher than the group's
final answer. Thus, quantitatively, it appears that the
study forms does not fit the actual trend in lower
318


 Previous Page
