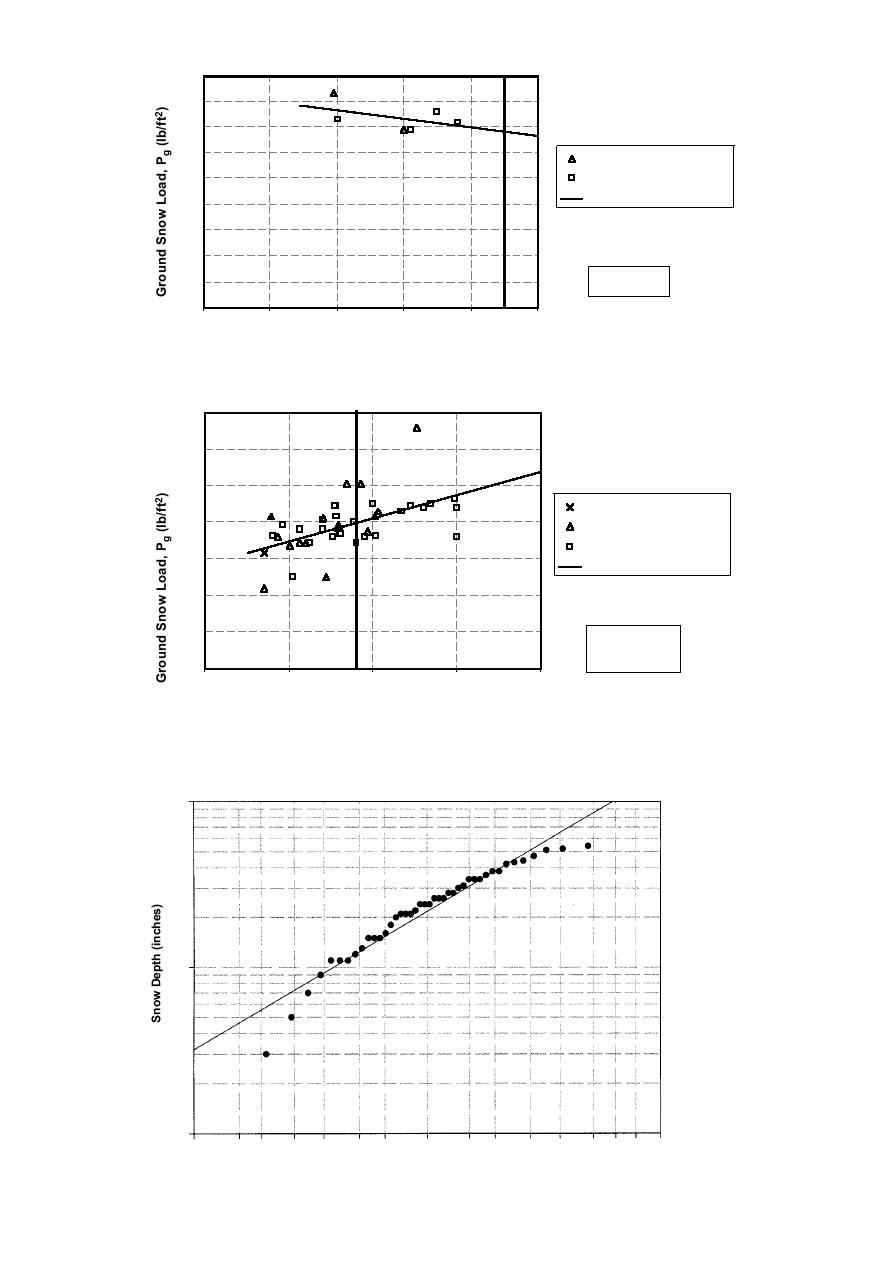
Salisbury, New Hampshire
(nearest 6 values)
90
90
80
All Data
70
NWS W.E.
60
NWS ""deptth"
WS deph"
Non--NWS W.E. .
on NWS W.E
50
Linearr (lleastt squarres)
ea ( eas squaes)
40
30
slope = -1.67 lb/ft2
per 100 ft
20
Pg = 68 lb/ft2
10
at Elev. 900 ft
0
0
200
400
600
800
1000
Elevation (feet)
Salisbury, New Hampshire
(all values within 25 miles plus nearest NWS first order value)
140
120
All Data
100
NWS W..E..
WE
80
NWS "deptth""
" ep h
Non-NWS W..E.
NWS WE.
60
Linear (leastt squarres)
as squa es)
40
slope = 2.54 lb/ft2
per 100 ft
20
Pg = 80 lb/ft2
at Elev. 900 ft
0
0
500
1000
1500
2000
Elevation (feet)
Figure 4. Case study plots for the town of Salisbury. Note that the scales on the two plots differ.
(To convert lb/ft2 to kN/m2, mulitply by 0.0479, for miles to km, multiply by 1.609, and for lb/ft2
per 100 ft to kN/m2 per 100 m, multiply by 0.1572.)
100
10
1
99.8
99 98
95
90
80 70
50
30 20
10
5
2
1 0.5 0.2
Annual Probability of Being Exceeded
(To convert inches to meters multiply by 0.025.)


 Previous Page
