For this case, the 06 UTC 15 March RWFS run was used to compare the forecasts with
the observations. This initialization time provides about a 7-hour forecast lead for the
start and a 26-hour forecast for the end of the main snow event. The air temperatures for
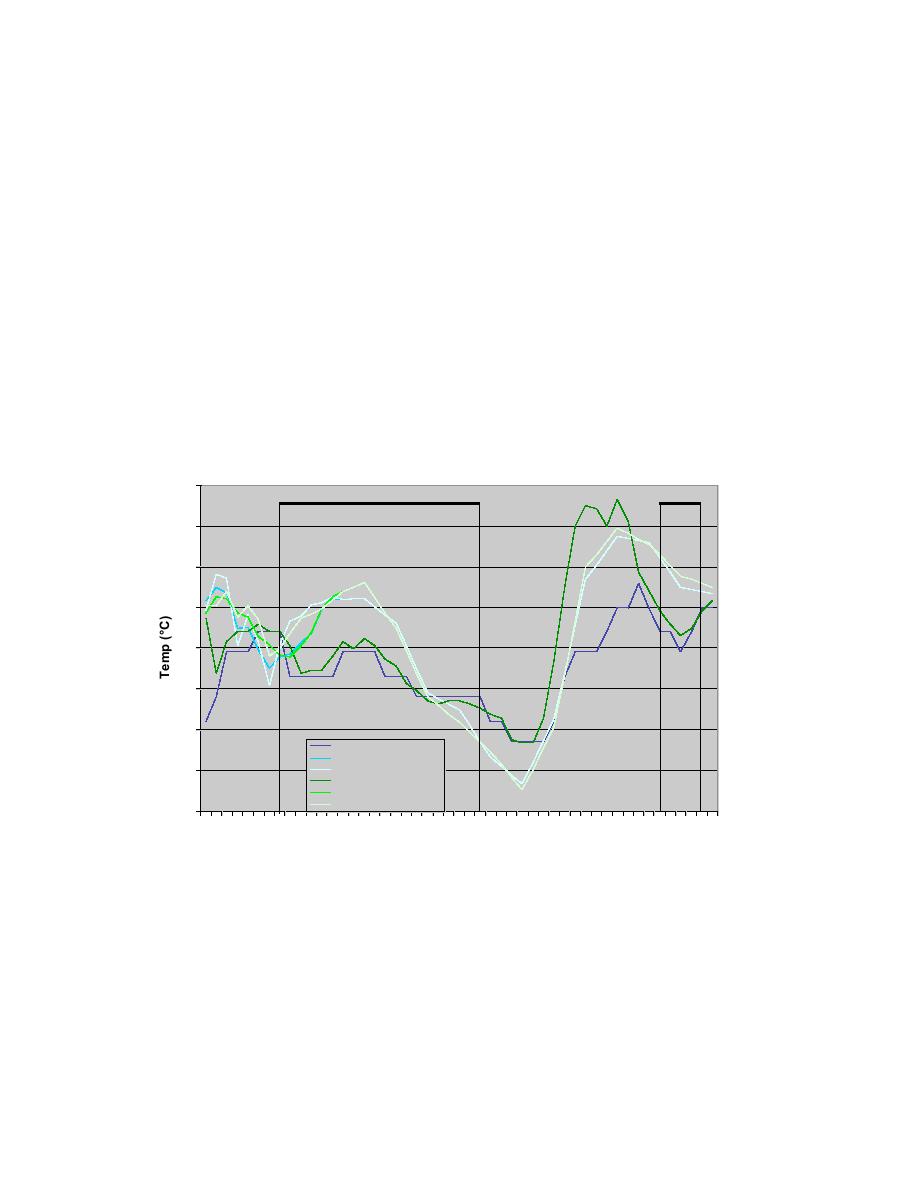
this case were fairly stable around 30F (-1oC). Fig. 10.53 shows a time series
comparison of the forecast and observed air temperatures for the 48 hour period covered
by this forecast. There are noticeable periods where the air temperature forecasts were
too warm, including some where the forecast temperature exceeded freezing, while the
observed temperature did not. In general, however, the forecast for both the METAR and
RWIS sites were within 1.5C during the entire case. The slightly warm forecasts during
the main snow event could have potentially affected the precipitation type forecast by the
system, but snow was, in fact, predicted for this entire event. One possible reason that
the system continued to predict snow with above freezing temperatures may be due to the
fact that the dew point temperature (wet bulb temperature) forecasts were less than 0C.
Air Temperature Comparison for Mar 15, 2004
3
AMW OB
AMW OB
2
1
0
-1
-2
-3
AMW METAR OB
AMW METAR wFSL
AMW METAR woFSL
-4
AMW RWIS OB
AMW RWIS wFSL
AMW RWIS woFSL
-5
6 8 10 12 14 16 18 20 22 0 2 4 6 8 10 12 14 16 18 20 22 0 2 4 6
Mar 15, 2004
Mar 16, 2004
Mar 17, 2004
Fig. 10.53. Air Temperature (C) time-series plot comparing the Ames
METAR and Ames RWIS observations to the RWFS forecasts (both with
and without the FSL supplemental models) for the METAR and RWIS site.
The vertical lines represent the time period that the Ames METAR was
reporting falling precipitation.
The dew point temperature time series (Fig. 10.54) shows good agreement between the
forecast and the observations as well. There was a point at the beginning of the event
where the METAR and RWIS observations diverge and the forecasts for the
82


 Previous Page
