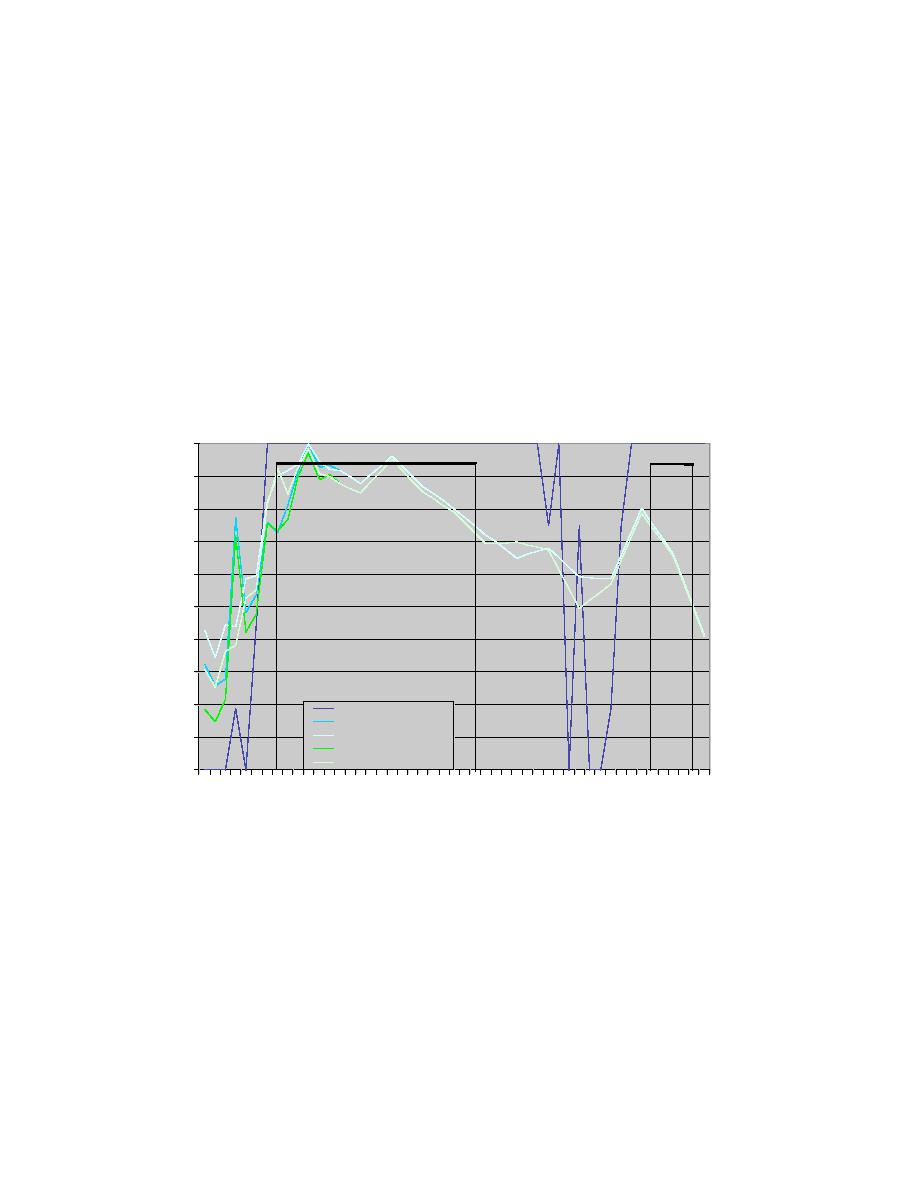
Cloud cover forecasts generally indicated greater than observed coverage before the
precipitation began (Fig. 10.57). The observed cloud cover quickly became overcast just
before the start of the snow event and remained that way throughout the main period of
snowfall. Forecasts of cloud cover were fairly good early in the main snowfall event but
incorrectly decreased from overcast to broken skies much earlier than the observations
indicated. A few hours of clear skies were reported at Ames between the two snow
events, then overcast skies returned during the second event, but the forecasts remained
in the broken range through this period. Thus, cloud cover was first over- then under-
forecast during the break and the second snowfall. This misforecast of cloud cover may
have had an affect on the diurnal temperature swings during this case (Fig. 10.53).
Cloud Comparison for Mar 15, 2004
1
OVC
AMW OB
AMW OB
0.9
0.8
0.7
BKN
0.6
0.5
0.4
SCT
0.3
0.2
AMW METAR OB
AMW METAR wFSL
AMW METAR woFSL
0.1
AMW RWIS wFSL
AMW RWIS woFSL
0
CLR
6 8 10 12 14 16 18 20 22 0 2 4 6 8 10 12 14 16 18 20 22 0 2 4 6
Mar 17, 2004
Mar 15, 2004
Mar 16, 2004
Fig. 10.57. Cloud cover time-series plot comparing the Ames METAR
only to the RWFS forecasts (both with and without the FSL supplemental
models) for the METAR and RWIS site. The vertical lines represent the
time period that the Ames METAR was reporting falling precipitation.
The QPF forecasts (Fig. 10.58) from the RWFS had very high values at the beginning of
the event, matching the heavy snow falling at that time quite well. Forecasts of POP and
QPF resulted in an expected event start time that was about 2 hours earlier than the start
of the actual precipitation at the METAR site when the FSL supplemental models were
not included. When the FSL models were included the start time was improved
somewhat, occurring within an hour of the actual start time at the METAR site. Since the
85


 Previous Page
