Home
Download PDF
Order CD-ROM
Order in Print
Home
>
Cold Research and Engineering Laboratory Reports
>
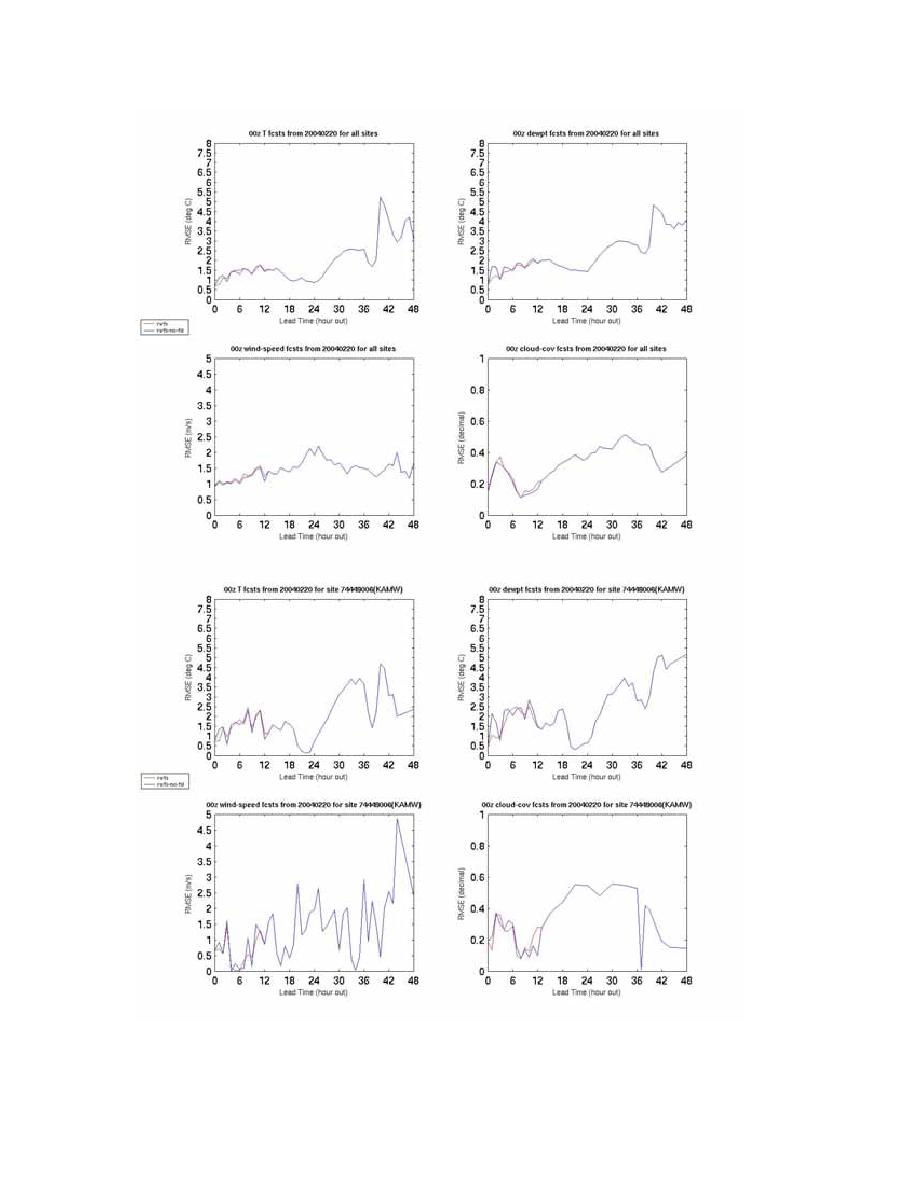
> Fig. 10.49. Same as Fig. 10.11, except Hr 0 = 00 UTC 20 February 2004
Fig. 10.48. Road Temperature (C) time-series plot comparing the Ames RWIS observations to the RWFS forecasts
Fig. 10.50. Same as Fig. 10.12, except Hr 0 = 00 UTC 20 February 2004
MDSS_Tech_Perf_Report_2912
Page Navigation
65
66
67
68
69
70
71
72
73
74
75
Fig.
10.49.
Same
as
Fig.
10.11,
except
Hr 0 = 00
UTC
20
February
2004.
77


 Previous Page
