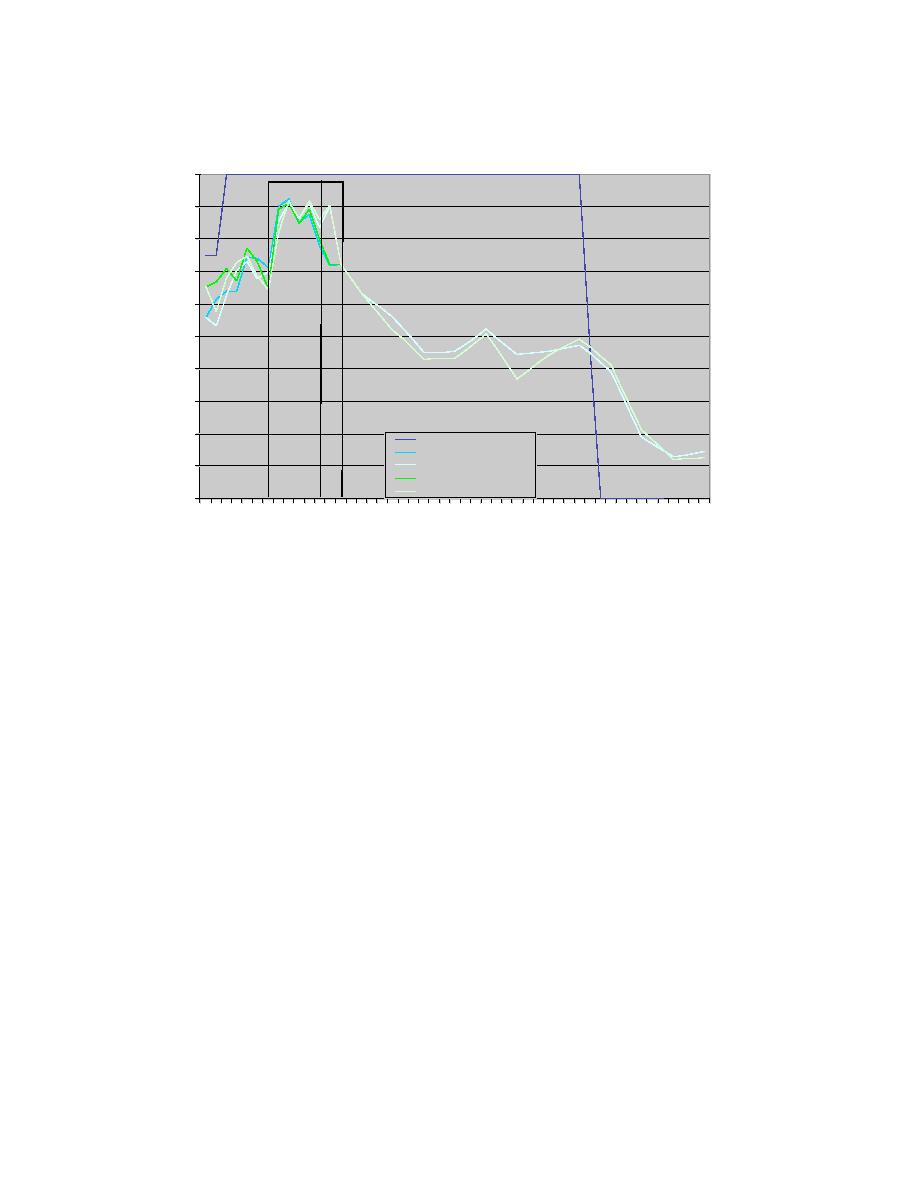
Cloud Comparison for Feb 20, 2004
1
AMW OB
OVC
RA
SN
0.9
0.8
0.7
BKN
0.6
0.5
0.4
0.3
SCT
0.2
AMW METAR OB
AMW METAR wFSL
0.1
AMW METAR woFSL
AMW RWIS wFSL
AMW RWIS woFSL
0
0 2 4 6 8 10 12 14 16 18 20 22 0 2 4
6 8 10 12 14 16 18 20 22 0
CLR
Feb 20, 2004
Time (UTC)
Fig. 10.40. Cloud cover time-series plot comparing the Ames METAR
only to the RWFS forecasts (both with and without the FSL supplemental
models) for the METAR and RWIS site. The vertical lines represent the
time period that the Ames METAR was reporting falling precipitation.
Wind speeds increased significantly as the low pushed off to the east-northeast and the
pressure gradient tightened behind it. The forecasts for wind speed (Fig. 10.41) looked
very good for the entire time series, especially during the time of the event. With the
increasing winds came decreased visibility during the short time period of snow. Fig.
10.42 shows the visibility comparison between the forecasts and the observations.
Forecasts are for good, but variable visibility during the time of reported rain. The RWIS
reported visibility is closer to the MDSS prediction than the METAR reported visibility.
During the time of reported snow the forecasted visibility is reasonably close to the
observations. Overall, the visibility pattern seemed to lag the observations, decreasing
too slowly before and during the precipitation and rising too slowly after it ended. This
lag is likely associated with forecasts of the precipitation ending well after it ended in
reality, as will be discussed in subsequent paragraphs.
69


 Previous Page
