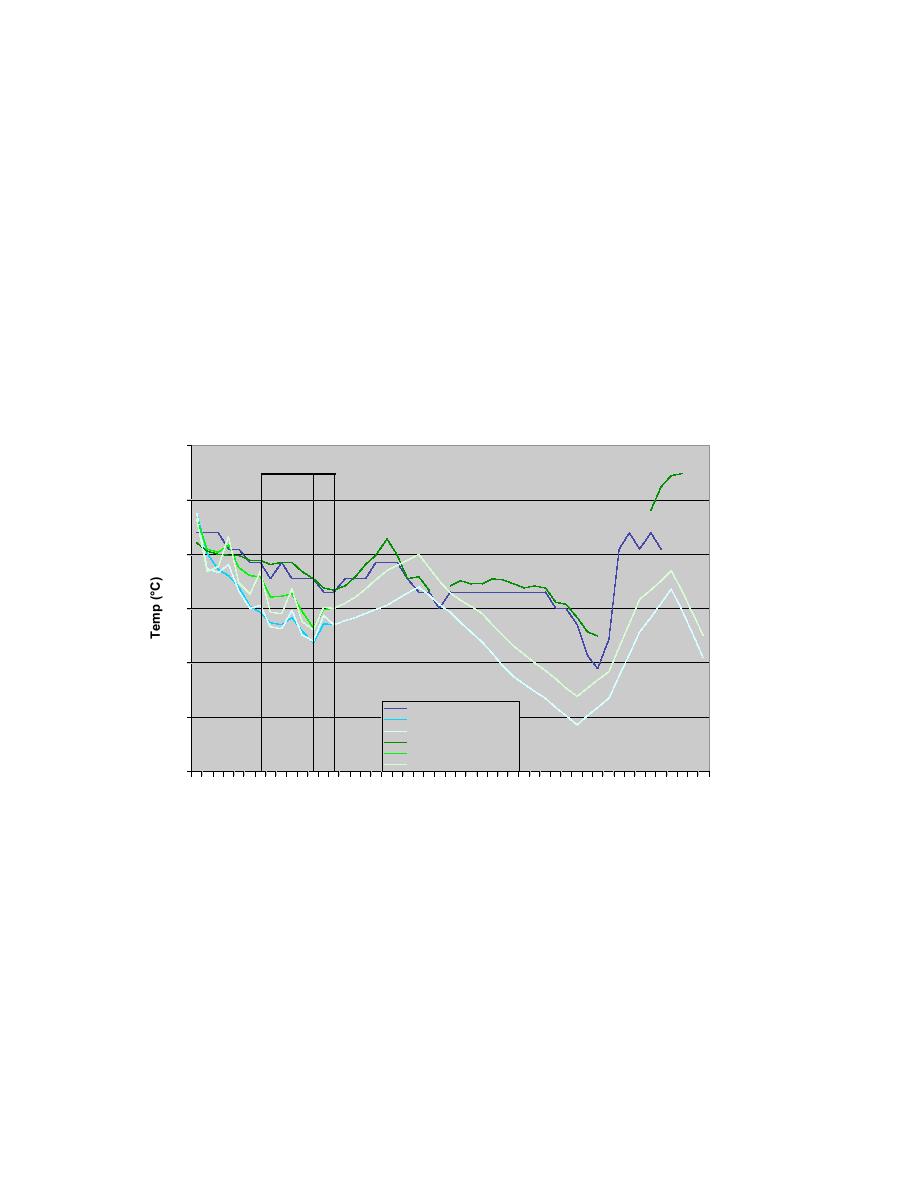
For this case the RWFS forecast initialized at 00 UTC on 20 February RWFS was
examined. Air temperatures were fairly steady around 0 to 2C during much of the
period (Fig. 10.38). Forecasts of air temperature were quite good before the precipitation
began, but decreased too rapidly just before and during the precipitation period,
becoming ~2C too cold. This is critical for predictions of precipitation type at these
temperatures because of the possibility for a mixed phase case such as this. After the
event the forecast air temperatures rebounded to match the observations briefly during the
evening hours, then again were much too low during the overnight hours. There are
some missing observations toward the end of the time series, but it is clear that the
forecasts never recovered to match the observations for this model run. The dew point
temperature comparison shows a very similar trend (Fig. 10.39).
Air Temperature Comparison for Feb 20, 2004
6
AMW OB
RA
SN
4
2
0
-2
AMW METAR OB
-4
AMW METAR wFSL
AMW METAR woFSL
AMW RWIS OB
AMW RWIS wFSL
AMW RWIS woFSL
-6
0 2 4 6 8 10 12 14 16 18 20 22 0 2 4
6
8 10 12 14 16 18 20 22 0
Time (UTC)
Feb 20, 2004
Fig. 10.38. Air Temperature (C) time-series plot comparing the Ames
METAR and Ames RWIS observations to the RWFS forecasts (both with
and without the FSL supplemental models) for the METAR and RWIS site.
The vertical lines represent the time period that the Ames METAR was
reporting falling precipitation.
67


 Previous Page
