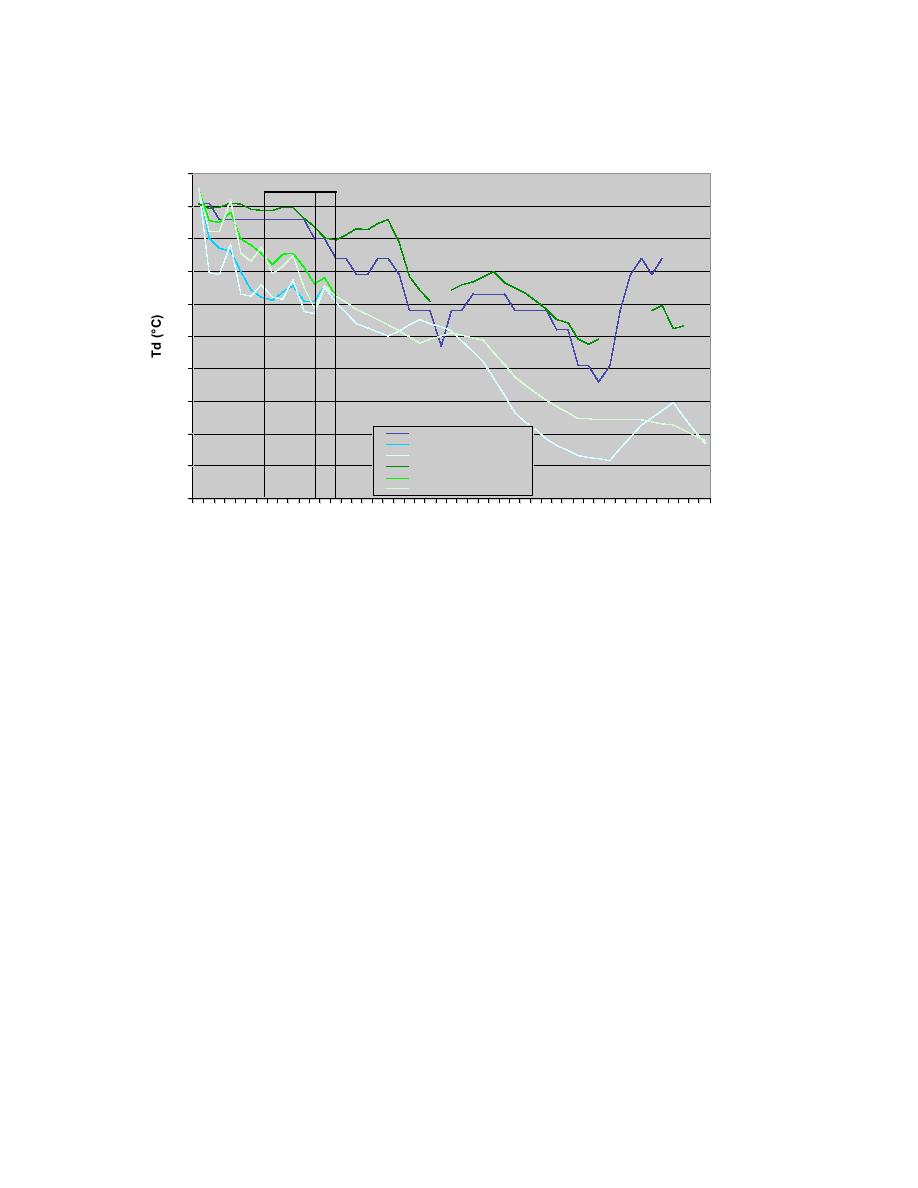
Dew Pt Temperature Comparison for Feb 20, 2004
2
AMW OB
RA
SN
1
0
-1
-2
-3
-4
-5
-6
AMW METAR OB
AMW METAR wFSL
AMW METAR woFSL
-7
AMW RWIS OB
AMW RWIS wFSL
AMW RWIS woFSL
-8
0 2 4 6 8 10 12 14 16 18 20 22 0 2 4 6
8 10 12 14 16 18 20 22 0
Feb 20, 2004
Time (UTC)
Fig. 10.39. Same as Fig. 10.38, except for dew point temperature (C).
Part of the temperature forecast problem after the event may be due to poor cloud cover
forecasts (Fig. 10.40). Following the cessation of precipitation, the forecast cloud cover
decreases dramatically from overcast to scattered skies. Ames METAR observations
indicated that skies remained overcast for the next ~24 hours. This lack of forecast cloud
coverage may have allowed for the predicted air temperatures to fall off more during the
night because less cloud insulation was forecast than observed.
68


 Previous Page
