150
Method 1
Method 2
100
Method 3
Method 4
Method 5
Method 6
Method 7
Numerical
Experimental
10
0
0
50
100
150
200
250
Average Temperature of Inside Surfaces (F)
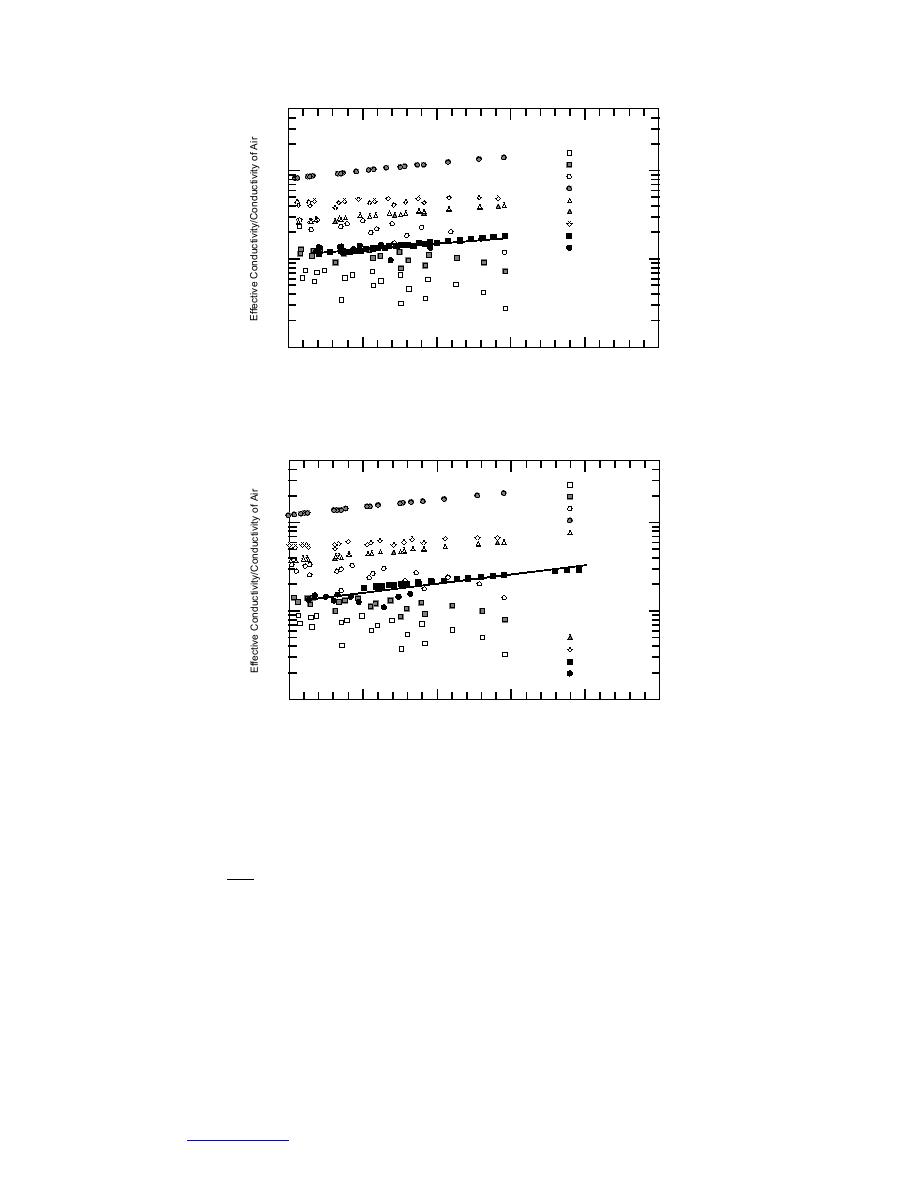
Figure 41. Ratio of effective conductivity to the conductivity of air vs.
the average interior temperature (4-in. insulated pipe).
150
Method 1
Method 2
Method 3
Method 4
100
Method 5
10
Method 6
Method 7
Numerical
Experimental
0
0
50
100
150
200
250
Average Temperature of Inside Surfaces (F)
Figure 42. Ratio of effective conductivity to the conductivity of air vs.
the average interior temperature (2-in. insulated pipe).
Curves of the following form were fit to the numerical and experimental data
in Figures 3942, and to the additional numerical data:
keff
= AeBTAVG
(133)
kair
where TAVG is the average of the interior surface temperatures and A and B are
defined in Table 10. Equations 134140 are plotted in Figure 43. Comparing eq 134
with eq 139 and 140 shows a reduction of 39% and 15% from radiation conditions
A to B and A to C, respectively.
In an attempt to correlate the coefficients in eq 134138 with a geometric param-
eter associated with the enclosure, it was found that a slight linear correlation
exists between the radius (r) of the interior pipe (or insulation) and the parameter
A (the intercept). These data and the correlation are shown in Figure 44. Using an
average value of the slopes (B) results in the following equation:
42
Go to Contents


 Previous Page
