5000
Method 1
Method 2
Method 3
1000
Method 4
Method 5
Method 6
Method 7
Experimental Data,
Both Pipes Heated
Experimental Data,
100
1 Pipe Heated
10
5
0
50
100
150
200
250
300
Average Temperature of Inside Surfaces (F)
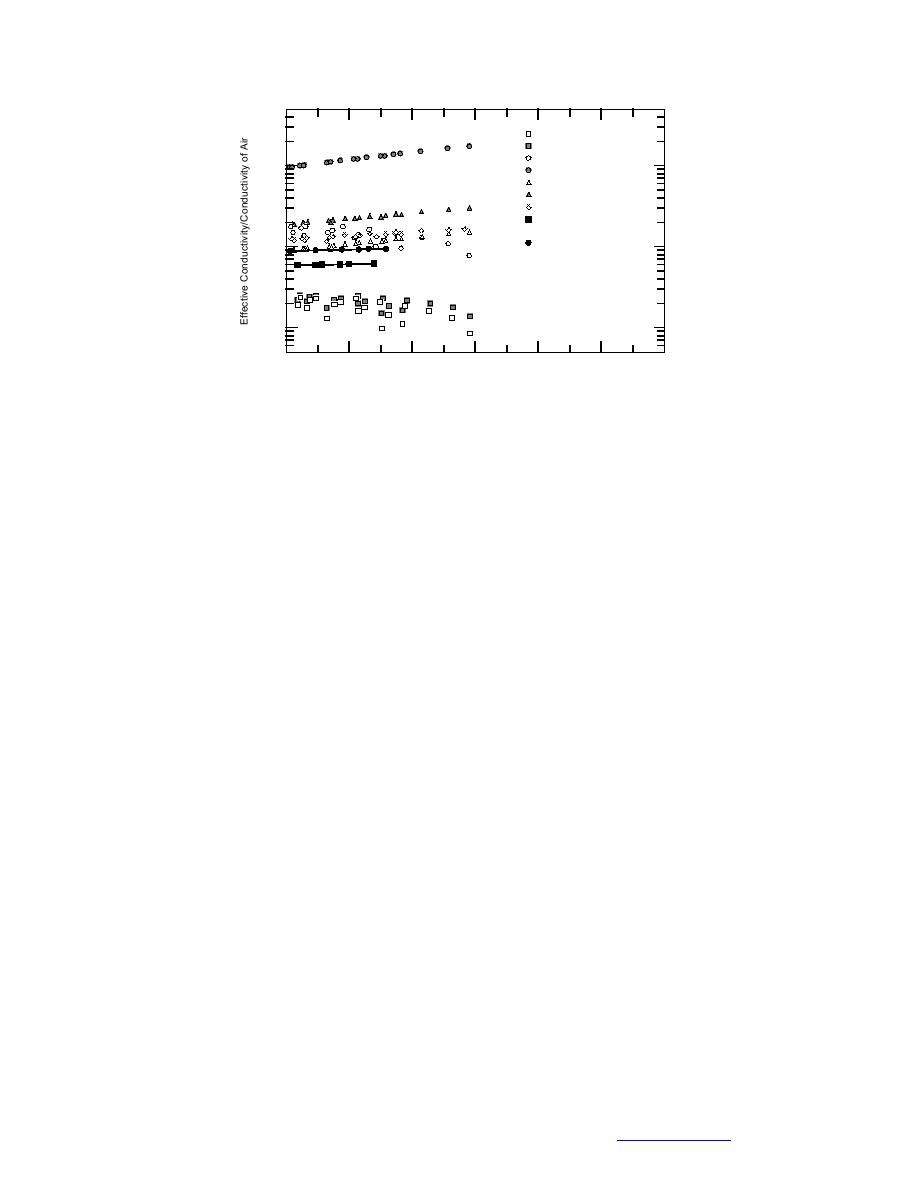
Figure 51. Ratio of effective conductivity to the conductivity of air vs.
the average interior temperature (2-ft 4-ft enclosure).
for the three cases were as follows: sq4ib65a, 95.20F and 95.20F; sq2d35c, 53.56F
and 55.25F; sq2ic65a, 91.83F and 90.82F, for the convection versus conduction
solutions, respectively. These average values agree very well, and if used in calcu-
lations of average heat loss, would give comparable values. Examining the insu-
lation enclosure temperature contours, it can be seen that approximately midway
through the insulation the temperature contours agree fairly well, but one reason
for this agreement is the fixed outer boundary temperatures.
A similar approach was followed using the 2-ft 4-ft experimental data. Figure
51 shows the comparison between the methods from Table 1 and the experimen-
tal data obtained with both pipes heated; weighted averages of the pipe insula-
tion surface temperatures were used (note that the Table 1 methods are for two
pipes heated at the same temperature, and shouldn't be compared with the
experimental data for the single heated pipe). These values are much higher than
those obtained from the smaller enclosure, and the intercepts do not correlate with
pipe (insulation) radius as determined earlier. The slopes are near zero, and the
intercepts (from curve fits) are 56.5836 and 86.6341 for the cases of both pipes heated
and a single pipe heated, respectively.
Because no numerical convection and radiation solutions were obtained for this
size enclosure, comparisons could be made only with the experimental data.
Using the physical experimental data from 13 January 1997 and FECOME with an ef-
fective conductivity determined by two methods, comparisons were made between
predicted and measured interior enclosure surface temperatures. Polynomial curve
fits were made to the temperatures measured on the exterior of the 0.5-in. insula-
tion (Fig. 52) and were applied as fixed boundary temperatures to the exterior sur-
face nodes of the mesh shown in Figure 53. The average pipe temperatures, 142.75F
and 146.20F, were used for the 4- and 8-in. pipes, respectively. Two values for the
effective conductivity of air were used. One value was determined by using the
effective radius of the two pipes (0.71354 ft) and eq 141, which yields a keff of
0.22863. The other value was 0.752115, determined from keff/kair = 56.584 (the curve
fit to the test data in Fig. 51), which resulted in a keff of 0.1773. The air temperature
(9.39F) from the experimental test data was used to determine kair.
47
Back to Contents


 Previous Page
