numerical and experimental data compare well in all five plots. For the uninsulated
pipes, the best agreement between the numerical and experimental data is with
methods 1 and 2, which use eq 37 and 38 to calculate the effective conductivity.
The differences caused by emissivity values can also be seen, with a slightly
reduced heat flux observed for the lower emissivity (condition C). For the insulated
pipes, there is general agreement between all the methods. This occurs because the
thermal resistance due to the air gap becomes small relative to the resistance of the
enclosure and pipe insulation.
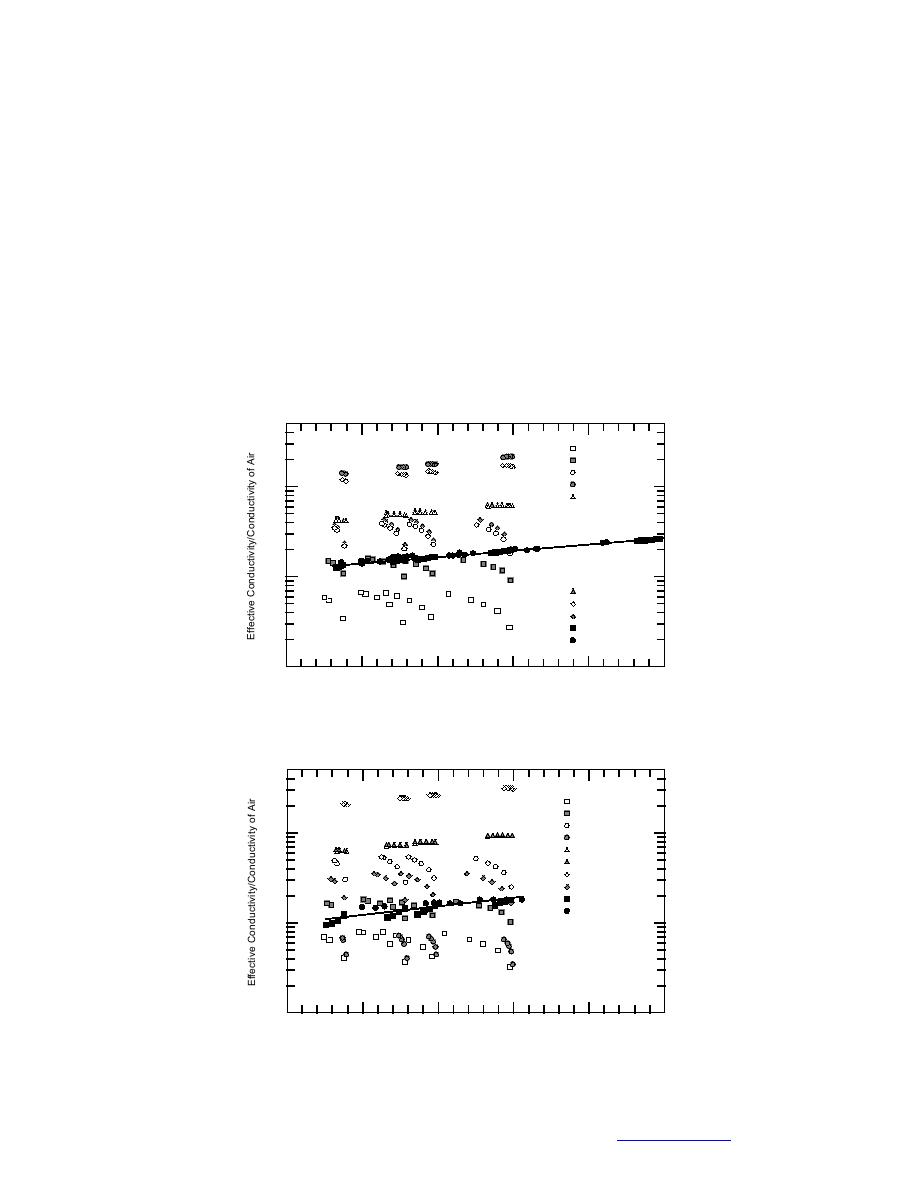
Figures 3942 compare the ratio of effective conductivity to the thermal conduc-
tivity of air (keff/kair) with the average temperature of the interior surfaces. The
effective conductivity was calculated using eq 36 and the heat flow through the
inside surface. Good agreement is seen between the numerical and experimental
test data, while comparison of the Table 1 methods, in some cases, shows effects of
temperature difference. Some of the methods show the same trend as the numerical
and experimental data but differ in magnitude (for example, method 4 in Fig. 42).
150
Method 1
Method 2
Method 3
Method 4
100
Method 5
10
Method 6
Method 7
Method 8
Numerical
Experimental
1
0
50
100
150
200
250
Average Temperature of Inside Surfaces (F)
Figure 39. Ratio of effective conductivity to the conductivity of air vs.
the average interior temperature (4-in. pipe).
150
Method 1
Method 2
Method 3
100
Method 4
Method 5
Method 6
Method 7
Method 8
Numerical
Experimental
10
0
0
50
100
150
200
250
Average Temperature of Inside Surfaces (F)
Figure 40. Ratio of effective conductivity to the conductivity of air
vs. the average interior temperature (2-in. pipe).
41
Back to Contents


 Previous Page
