250
Method 1
Method 6
Method 2
Method 7
200
Method 3
Method 8
Method 4
Numerical
Method 5
Experimental
150
100
50
0
0
50
100
150
200
Temperature Difference (F)
a. Radiation A.
250
Method 1
Method 6
Method 2
Method 7
200
Method 3
Method 8
Method 4
Numerical
Method 5
Experimental
150
100
50
0
0
20
40
60
80
100
120
140
160
Temperature Difference (F)
b. Radiation C.
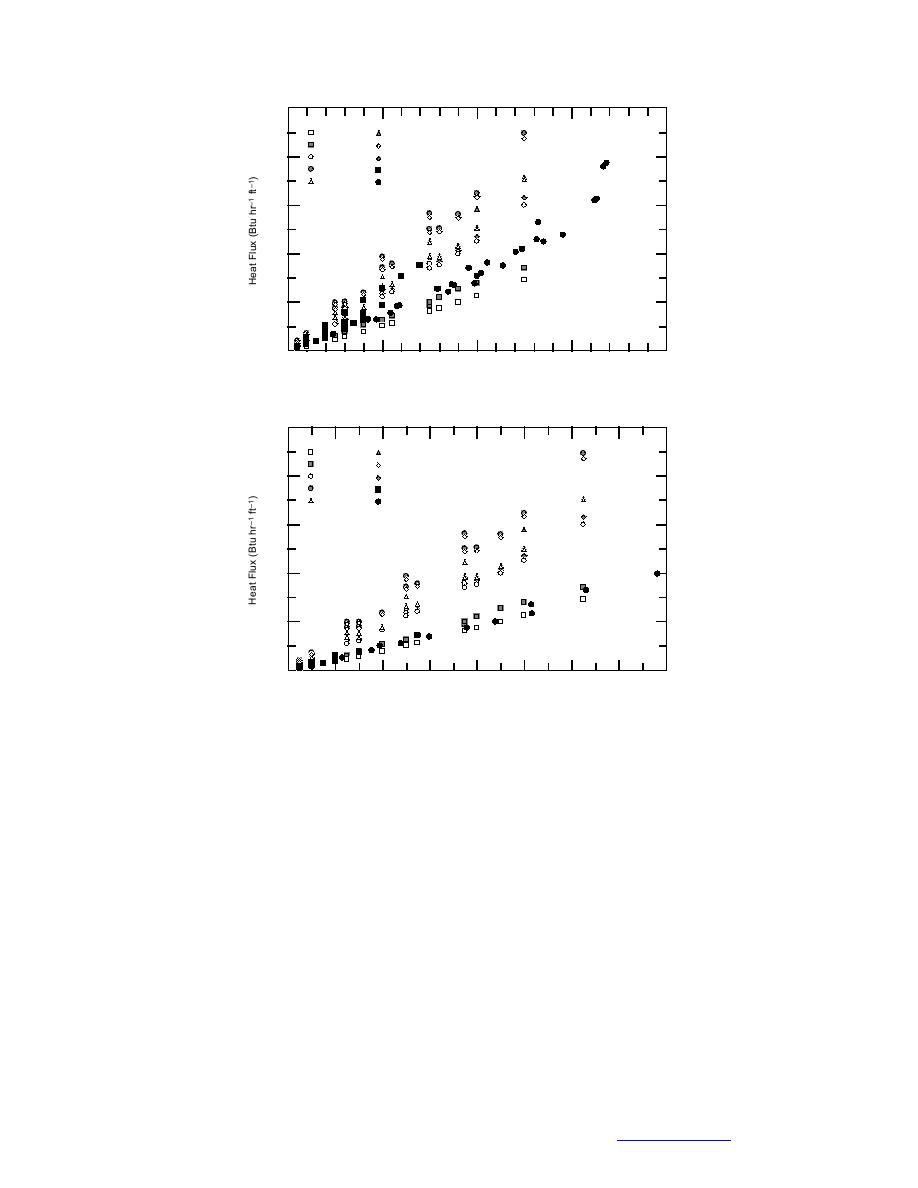
Figure 35. Heat flux from the 4-in. pipe through the 1-ft 1-ft enclosure.
ANALYSIS
The Nusselt NumberRayleigh Number plots in the previous section showed
that no simple direct correlation between these parameters would be found. Com-
parisons of other parameters are made in this section and a new approximation
for the effective conductivity of air is proposed. Comparisons of numerical solu-
tions using this effective conductivity correlation are made with those obtained
using FECOME and with experimental data from the 2-ft 4-ft enclosure.
Figures 3538 compare heat-flux-per-foot data from the numerical and experi-
mental results with the eight methods presented in Table 1 for four configurations
of the 1-ft 1-ft enclosure. Figures 35 (a) and (b) compare the effect of emissivity
values for radiation conditions A and C. In these figures, temperature difference
is the total temperature difference for the system; heat flux is through the mean
perimeter of the enclosure. Using the methods in Table 1 to determine the effec-
tive conductivity of the air, the heat flux was calculated using eq 5157. Vertical
scatter within a given method is related to the average interior temperatures. The
39
Back to Contents


 Previous Page
