2 in.
6 in.
6-in. diameter
3-in. diameter
6 in.
2 in.
5.15 in.
2 in.
2 in.
6 in.
6 in.
28 in.
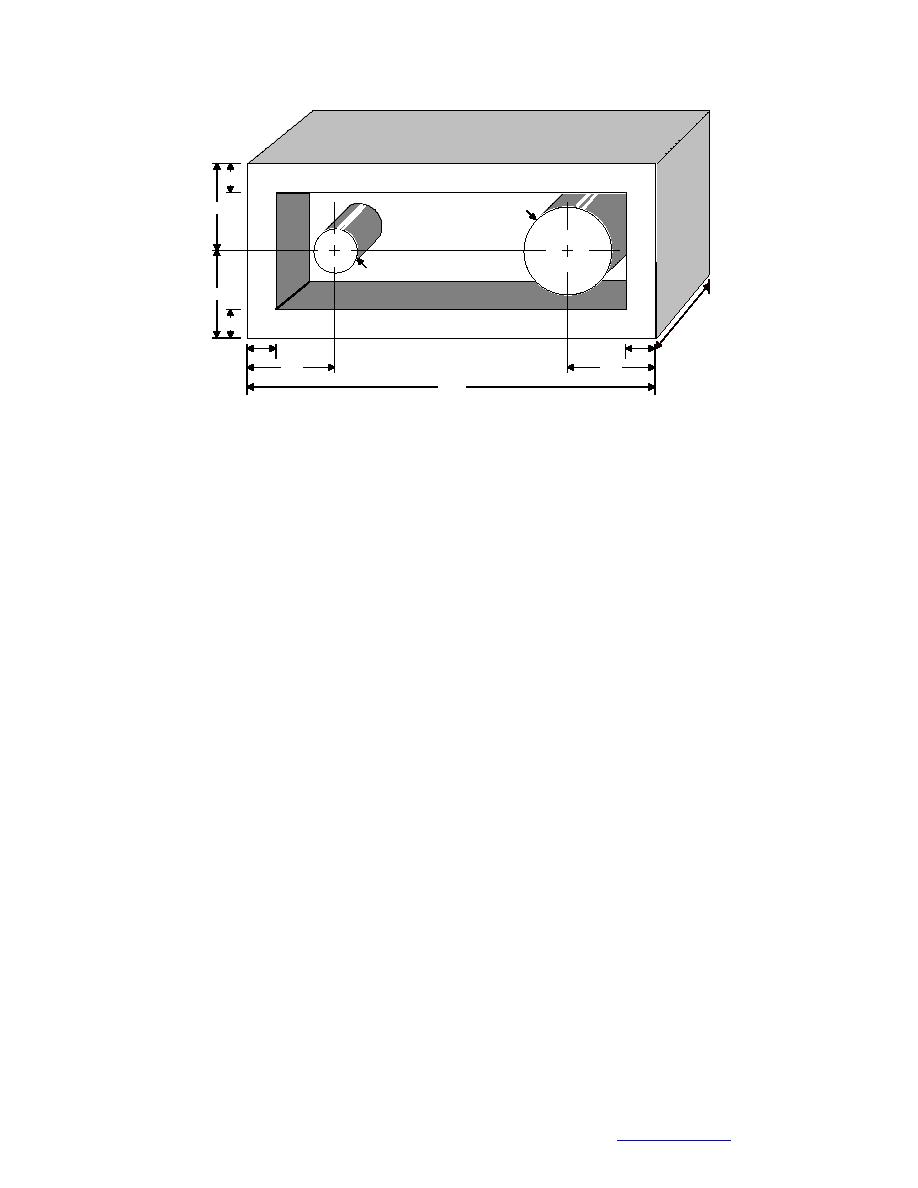
Figure 5. Experimental configuration of Stewart and Verhulst (1985)
Stewart and Verhulst (1985) presented the results of experiments in which two
heated cylinders were in a cooled rectangular enclosure. Figure 5 shows their
apparatus, which was filled with distilled water; measurements were made with
both cylinders heated and when heated individually. They investigated a number
of different characteristic lengths and found that the best correlation (least devia-
tion from the data) occurred when the hypothetical gap width L was used. (When
more than one pipe was used to calculate L, an effective radius that included both
interior pipes was used.)
For both cylinders heated
NuL = 0.420RaL.219
0
(L includes both cylinders)
(43)
NuL = 1.534Ra L.169
0
(L using large cylinder only)
(44)
NuL = 0.231Ra L.243
0
(L using small cylinder only).
(45)
For only one cylinder heated
NuL = 0.256Ra L.266
0
(large cylinder heated, L using large
(46)
cylinder only)
NuL = 0.027 Ra L.371
0
(small cylinder heated, L using small
(47)
cylinder only).
Babus'Haq et al. (1986) used interferometric flow visualization to determine the
optimized location of a single warm pipe in a cool square enclosure with the antici-
pated application being district heating distribution lines, i.e., utilidors. Figure 6
is a diagram of their experimental apparatus. Although Babus'Haq et al. did not
develop any heat transfer correlations per se, their data for heat loss from a cen-
tered pipe to the enclosure walls can be represented by
NuG = 0.34GrD.25
0
(48)
9
Back to Contents


 Previous Page
