(21C, 70F) and at low temperature (30C, 22F)
under wet and dry conditions. Results of the Dou-
glas fir flexural tests are summarized in Table 10.
The moisture percentages of the wet specimens
of both the RPC and the Douglas fir were deter-
mined immediately before the flexure tests by the
weight gain (difference between wet density and
dry density) of each specimen after water immer-
sion. The moisture gain varied with time. A sum-
mary of the results is presented in Table 11. The
data in Table 11 show that for a given size of speci-
men, moisture ingression was greater in the Dou-
glas fir than in the RPC.
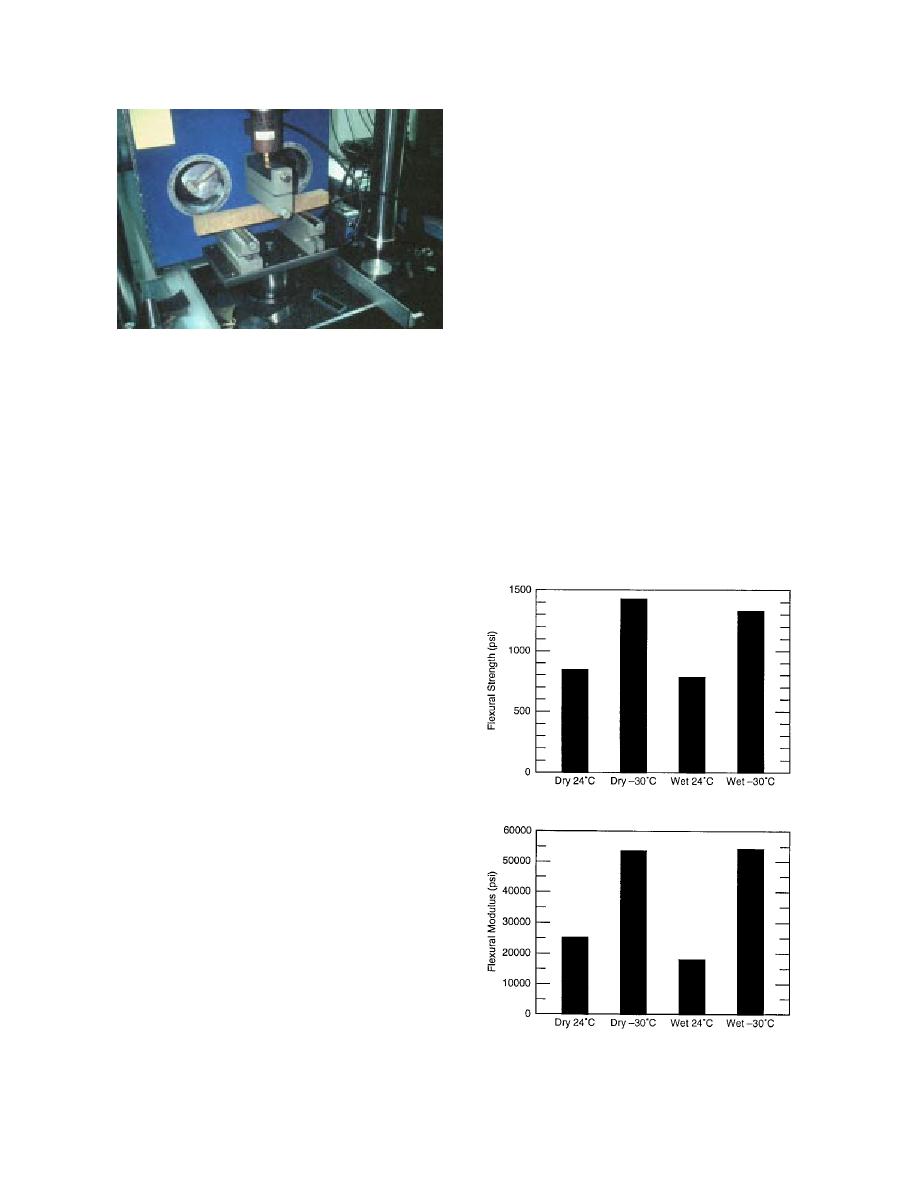
Figure 52. Flexural testing of the RPC.
The influence of temperature and moisture in-
gression on the flexural behavior of the RPC is
represented in Figure 53. Figure 53a shows the
flexural strength (S) and Figure 53b the flexural
modulus (Ef). They show that low temperature
same for the y direction specimens, respectively.
influenced the flexural behavior of the RPC sig-
The material clearly shows a significant amount
nificantly--in fact, much more significantly than
of variability in properties between the speci-
moisture. The average values from all tests are
mens. However, the y direction specimens are
summarized in Table 12. The flexural strength
stronger and stiffer overall than the x direction
for the dry RPC specimens (specimens DCD)
specimens. It is possible that transverse pressure
increased approximately 63% at 30C (22F),
and compacting of the materials at the time of
and the flexural modulus by approximately
forming in the die impart a higher strength to the
material.
Flexural testing
As in compression, flexural testing of the
RPC was performed at room temperature and
low (30C) temperature for both dry and wet
conditions, using the servohydraulic machine and
a three-point bending fixture (Fig. 52). The data
were recorded by the electrical data acquisition
system. The flexural strength (S) and the flexural
modulus (Ef) were calculated using the follow-
ing equations for three-point bending of thin elas-
tic solids:
a. Flexural strength.
S = (3PL)/(2bd2)
where P
=
load on the beam
b
=
width of the beam
d
=
depth of the beam
L
=
span between the support points
δ
=
deflection of the beam.
All specimens were cut to the nominal size of
38.1 38.1 406.4 mm (1.5 1.5 16 in.). The
span (L) for all tests was 203.2 mm (8 in.). Results
from these tests are given in Table 9.
For the purpose of comparison, wood speci-
mens of Douglas fir of the same dimensions (38.1
b. Flexural modulus.
38.1 406.4 mm, 1.5 1.5 16 in.) were prepared
Figure 53. Results of flexural testing of the RPC.
and tested in flexure, both at room temperature
36


 Previous Page
