perature, soil moisture, and water level. Before
difficulties. A number of tests and measurements
dredging started, two falling water percolation
of retention basin parameters were made in 1996
tests were performed in the basin. Soil moisture
before and after the conclusion of dredging. The
analyses were also conducted on the basin sedi-
investigations performed on the basin are out-
ment and liners before dredging resumed. The
lined below.
study of the natural attenuation of planted parti-
cles in the basin was continued in a limited scope,
Basin percolation tests
and some predredging sediment thicknesses in
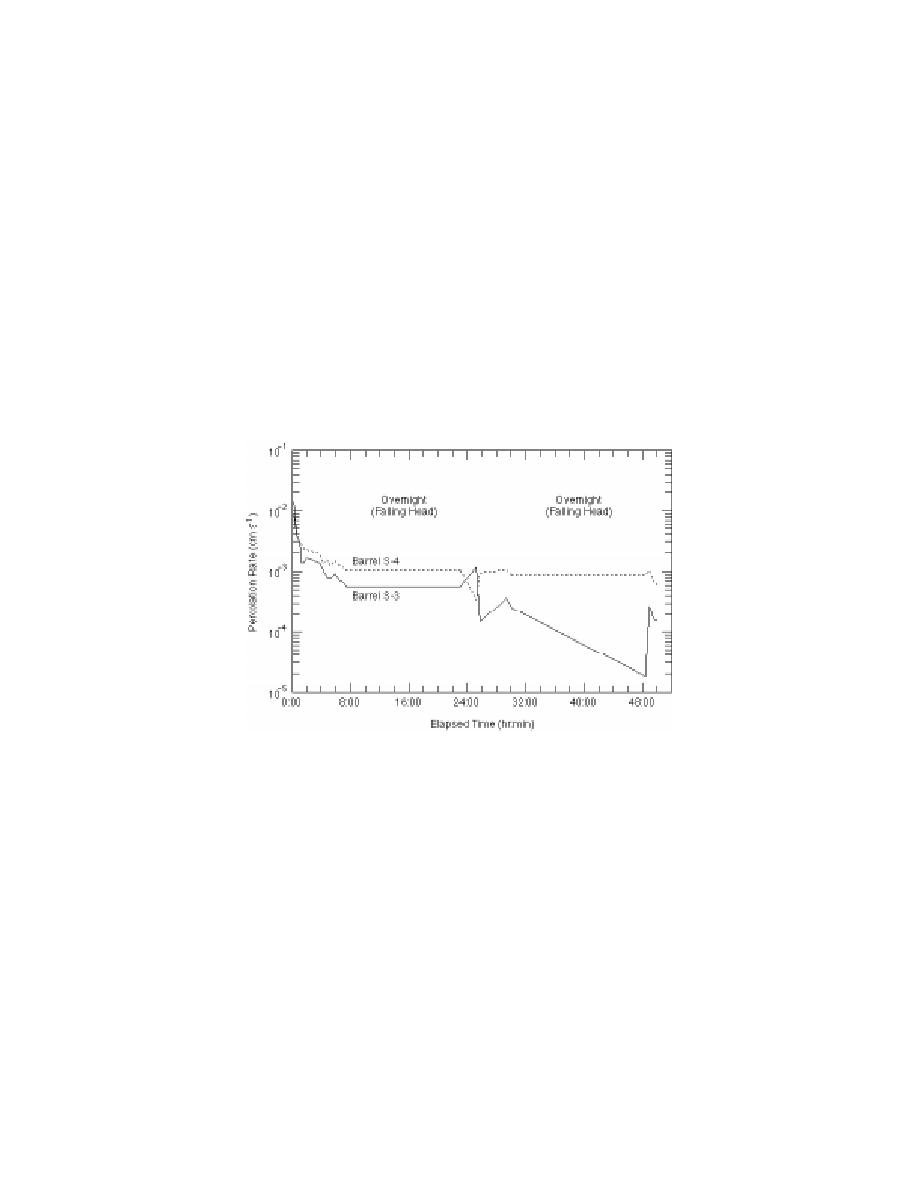
Before resumption of dredging in 1996, falling
the basin were measured. After completion of the
water percolation tests were performed on the
dredging operations, grab samples were collected
basin liner to ensure its integrity and suitability
from the dredged area and analyzed for white
for reuse. Two percolation barrels were set in the
phosphorus. In addition, the area dredged was
liner, one in an area of low sedimentation and one
surveyed, salinity measurements were taken at
in deep sedimentation near the spoils line outfall.
various locations, organic contents of the basin
These were not rigorous percolation tests (no
liner and sediments were measured, two samples
bentonite sealer was used) and thus only give a
of the basin sediment were collected and anal-
rough indication as to the condition of the liner.
yzed for white phosphorus, and an overflight of
However, both tests indicated a percolation rate
the Flats was scheduled to obtain photo maps.
Figure 10. Results of 1996 basin percolation tests.
above the acceptable level of 106 cm/s (see App.
RESULTS OF 1996 WORK
C and Fig. 10). For reference, work done in 1994
A number of investigations were carried out to
by Chamberlain and Walsh (Racine and Cate
evaluate the feasibility of continuing the dredg-
1995, Walsh et al. 1996) showed that percolation
ing operations. In some cases, data are limited
rates of Flats water through the gravel base below
and only general conclusions may be drawn.
the basin was on the order of 103 cm/s.
More specific information can be drawn from the
The higher percolation rates are probably
in-depth work, such as postdredging sampling
caused by a reduction in liner density due to the
and analyses. The following is a breakdown of
severe freezethaw cycling that occurred over the
studies conducted at ERF in 1996 based on gen-
previous winter, when lack of snow exposed the
eral area and specific task. The results are sum-
liner to repeated temperature fluctuations. The
marized later.
lack of funds for improving the liner as well as
the proximity of the test results to acceptable lev-
Basin investigations
els resulted in the use of the basin in the condition
The retention basin sits on an EPA-designated
found.
Solid Waste Management Unit (SWMU), and as
A limited number of sediment moisture con-
such, we felt it critical that we monitor as many
tent tests were conducted. These are discussed
relevant parameters as possible to avoid future
10


 Previous Page
