yzed, three were contaminated with white phos-
and affects the hydraulic conductivity. It also af-
phorus, for a 25% contamination rate. One of five
fects the frost susceptibility of the liner: Higher
water samples taken from the outflow line was
organic content means that more moisture may
slightly contaminated (< 1 g/L) (App. C). The
be held in the material, leading to frost deconsol-
idation of the liner. Table E2 in Appendix E shows
small number of samples taken limits the conclu-
that the organic carbon content of the liner is
sions that can be drawn from the data, although
more than twice that of the sediments commonly
results are similar to those found during the larger
found in the Flats. The average of the six samples
sampling program conducted in 1995.
is 11%, with a median value of 10.9% and stan-
Dredging in 1996 took place in an area known to
dard deviation of 1.5. This high organic content
be more highly contaminated than the areas
may well have resulted in deconsolidation of the
addressed the previous two years, which may
compacted liner through freezethaw cycling
account for the differences in positive results. Re-
and may have contributed to the increase in hy-
sults of the spoils line sample analyses indicate
draulic conductivity experienced over the winter
that contaminated material continued to be trans-
of 19956.
ferred from the Flats to the retention basin.
Post-dredging sampling
Dredge monitoring
The actual dredge monitoring segment of the
Post-dredging sampling occurred in October. Be-
work plan was scaled back to include only occa-
cause the area had been swept by an unexploded
sional visits by one of us (Collins) to the site to
ordnance detection contractor, bottom surface grab
determine if the contractor was addressing the
sampling was possible. Sampling occurred over
areas originally delineated. Although funding for
transects oriented perpendicular to the dredge
this segment of the work plan was never re-
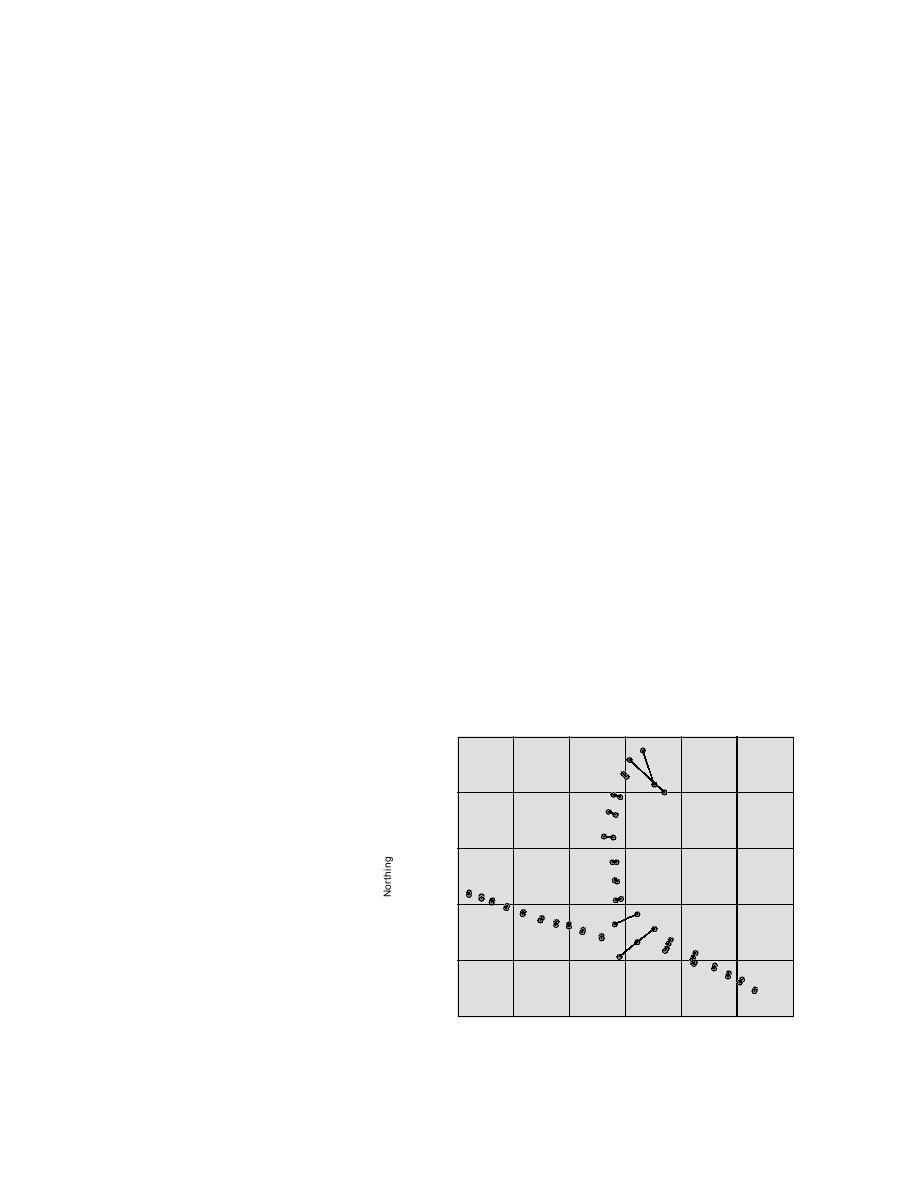
path in all areas except the Clunie Inlet area (Lines
ceived, we did continue the work using funds
1 and 2, Fig. 12). Sampling in this area and in an
from an unrelated source. In addition, some
area along Clunie Point dredged over the last two
spoils and supernatant sampling and analyses
seasons was done for reference. Sampling transects
were conducted during dredging operations. In
were spaced approximately every 10 m. The
September, some funding was restored to sample
transects were surveyed after completion of samp-
ling (Fig. 12). An aerial photo of the area depicting
the dredged area for white phosphorus contami-
the sites is shown in Figure 13.
nation. As funds were limited, a new method of
Sampling data for the dredged area can be
composite sampling, developed by Marianne
found in Appendix C. All samples were sieved
Walsh of CRREL (M.E. Walsh et al. 1995), was
used to maximize the area sampled while mini-
composite samples, using a Wildco 190-E20 541-
m sieve bucket (S/N 0594). Subsample points
mizing the number of analyses performed. The
dredged area was then surveyed, as
6,801,350
was the sediment delta in the reten-
tion basin. Again, the survey work is
Line 2
3
discussed later in this report. Finally,
4
Line 1
6,801,300
Aeromap, Inc., was contracted to col-
5
lect 1:6,000 aerial photos of the Flats.
Aerial photos were needed to docu-
6
6,801,250
ment several ongoing projects at
7
ERF, including the pond-draining
8
27 26
study, dredging, natural attenuation,
9
6,801,200
and physical systems dynamics.
10
25
24
11
23
22
12
21 20
Spoils line and supernatant sampling
19
13
18
14
and analysis
6,801,150
15
16
A small number of samples were
17
collected for analysis during dredg-
ing operations at the Flats in 1996.
6,801,100
355,400
355,150
355,200
355,250
355,300
355,350
355,450
These samples were taken on 13, 21,
and 28 August and analyzed at
Easting
CRREL. Of 12 spoils samples anal-
Figure 12. Sampling transects in dredged area.
13


 Previous Page
