14,000
12,000
10,000
Frozen
8,000
Unfrozen
6,000
4,000
2,000
0
0
5
10
15
Moisture Content (% dry density)
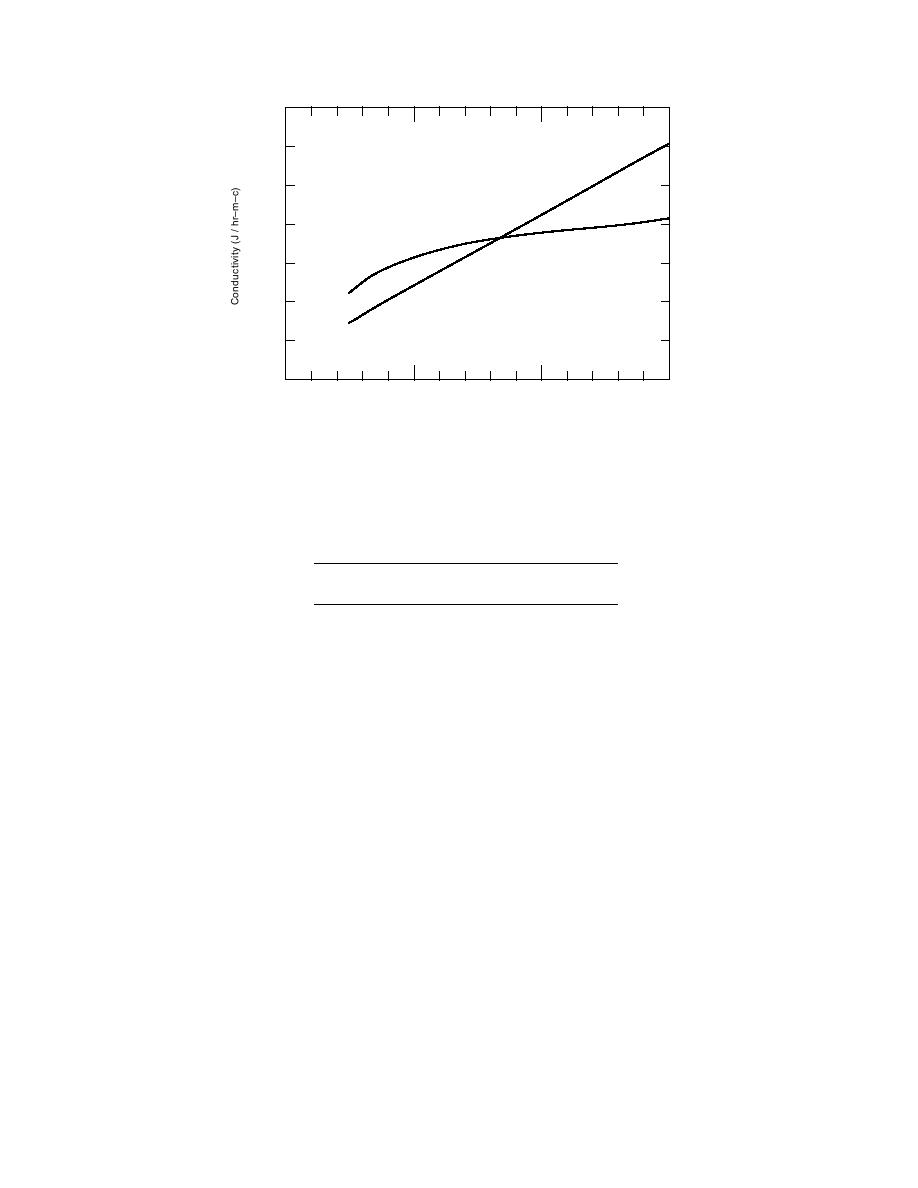
Figure 12. Frozen and unfrozen thermal conductivity, plotted against
moisture content, of 1800 kg/m3 sandy soil. (From Kersten 1949.)
Table 1. Uncorrected and corrected Labossiere
ledge material properties.
Conductivity
Density
Specific heat
(J/hr m C)
(J/kg C)
(kg/m3)
Uncorrected ledge
9242
2700
879
Corrected ledge
6208
2700
1375
1/ke = xs / ks + xf / kf.
influence the thermal conductivity of the material,
as opposed to assuming only rock. After the first
This procedure produces upper and lower
year's assessment of the results, it was evident that
bounds for the conductivity based upon the posi-
the ledge conductivity in the model was too high to
tion of the moisture relative to the heat flow. The
represent in-situ conditions. The conductivity was
values used for the uncorrected and corrected La-
subsequently altered by determining an effective
bossiere ledge material are shown in Table 1.
thermal conductivity of the ledge and water togeth-
Sand backfill has a relatively small (2% to 8% by
er by using simple Wiener bounds (Farouki 1981)
weight) moisture content that varies depending
based upon estimates of the volumetric moisture
upon the type and quality of the material.
content.
The 2nd Avenue and Wentworth Street sites had
This procedure works by first assuming the
parent material consisting of gravelly sand with an
water and ledge occur as two separate blocks in a
appreciable amount of fines, medium clean sand
parallel arrangement with the heat flow. The effec-
backfill, and ledge. The ledge at both of these sites
tive thermal conductivity for this arrangement is
was beneath the pipe and therefore did not con-
the upper limit of the conductivity and is given by
tribute to a faster and deeper freeze-front pro-
gression down to the pipe. The parent material
ke = xsks + xfkf.
outside of the trench was modeled as a sand with
low moisture content to obtain a conservative
The subscripts s and f refer to solid and fluid, re-
(deeper) freeze-front progression than would be
spectively, and x is the volume of the material per
present if it were a soil with a much higher mois-
total unit volume. The lower limit of the effective
ture content. Table 2 shows the thermal proper-
conductivity is given by arranging the fluid and
ties used in the modeling.
solid portions in series with the heat flow:
10


 Previous Page
