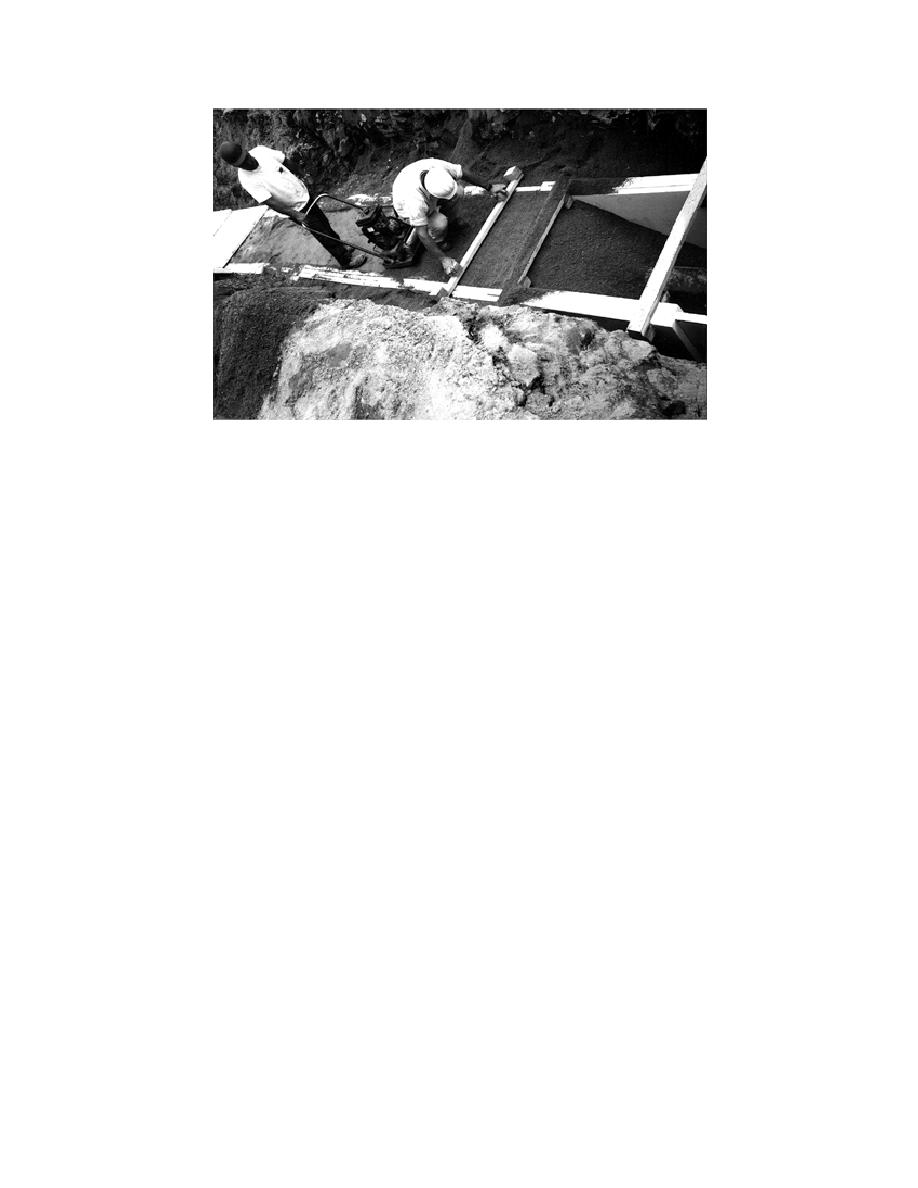
Figure 11. Insulation shield side boards in place with sand backfill being leveled
off and compacted. Bottom and top wooden jigs hold sides in place during construc-
tion. Bottom remain in place and top ones are removed before top insulation is placed.
Material properties
There was one main TC location about mid-
Moisture content is probably the most impor-
way along the shielded section of pipe. Ledge
tant property to be considered in the thermal
was located here about 1.5 m (4.95 ft) deep. The
modeling of in-situ material, due to its effect
bottom of the pipe was about 1.3 m (4.3 ft) deep.
upon the thermal conductivity of the material as
Several TCs were located around and in the
well as the retarding effect the latent heat of water
shield, with several positioned vertically above
has on the progression of the freeze front. Fur-
the shield extending to the surface. An immersion
thermore, the frozen and unfrozen thermal con-
TC was placed in the pipe to record water temper-
ductivity of soil can vary according to moisture
atures. (Thermocouple locations are shown in
content density and soil type. Figure 12 is a plot
Figure 8.) Two TCs were placed at the beginning
taken from data by Kersten (1949) showing the
of the pipeline: one under the horizontal insula-
difference in frozen and unfrozen thermal con-
tion and one above. In addition to the buried TCs,
ductivity of an 1800 kg/m3 sandy soil with vary-
one was also installed beneath the datalogger
ing moisture content. This would be similar to the
enclosure box to record air temperatures at the
backfill sand used around the pipes. It can be
site.
seen that at moisture contents below about 9%,
the frozen conductivity is lower than the unfro-
zen conductivity even though the thermal con-
MODEL VERIFICATION
ductivity of ice is about 31/2 times greater than
Boundary conditions
water. Balanced against the greater thermal con-
The temperatures recorded at the three sites
ductivity is the retarding effect the latent heat of
were used to provide boundary conditions to the
the moisture has upon frost penetration.
FE simulations to verify the agreement between
The materials present at the Labossiere Street
actual and predicted temperatures. The prelimi-
site were the backfill sand and ledge. The ledge
nary design mesh was changed to reflect the actu-
was at first modeled as a continuous mass of solid
al physical configuration present after construc-
rock that had a relatively high thermal conductivi-
tion. The recorded surface temperatures at the
ty. During construction, it was evident that much
sites were used as the top boundary conditions,
of the ledge was fractured, and water was seen to
with the immersion TC data providing the pipe
come out of the drill holes used to insert charges for
boundary condition.
the blasting. These seams of water would greatly
9


 Previous Page
