(C-days) (F-days)
3000
1600
1200
2000
800
1000
400
Buffalo, MN
0
0
1960
1970
1980
1990
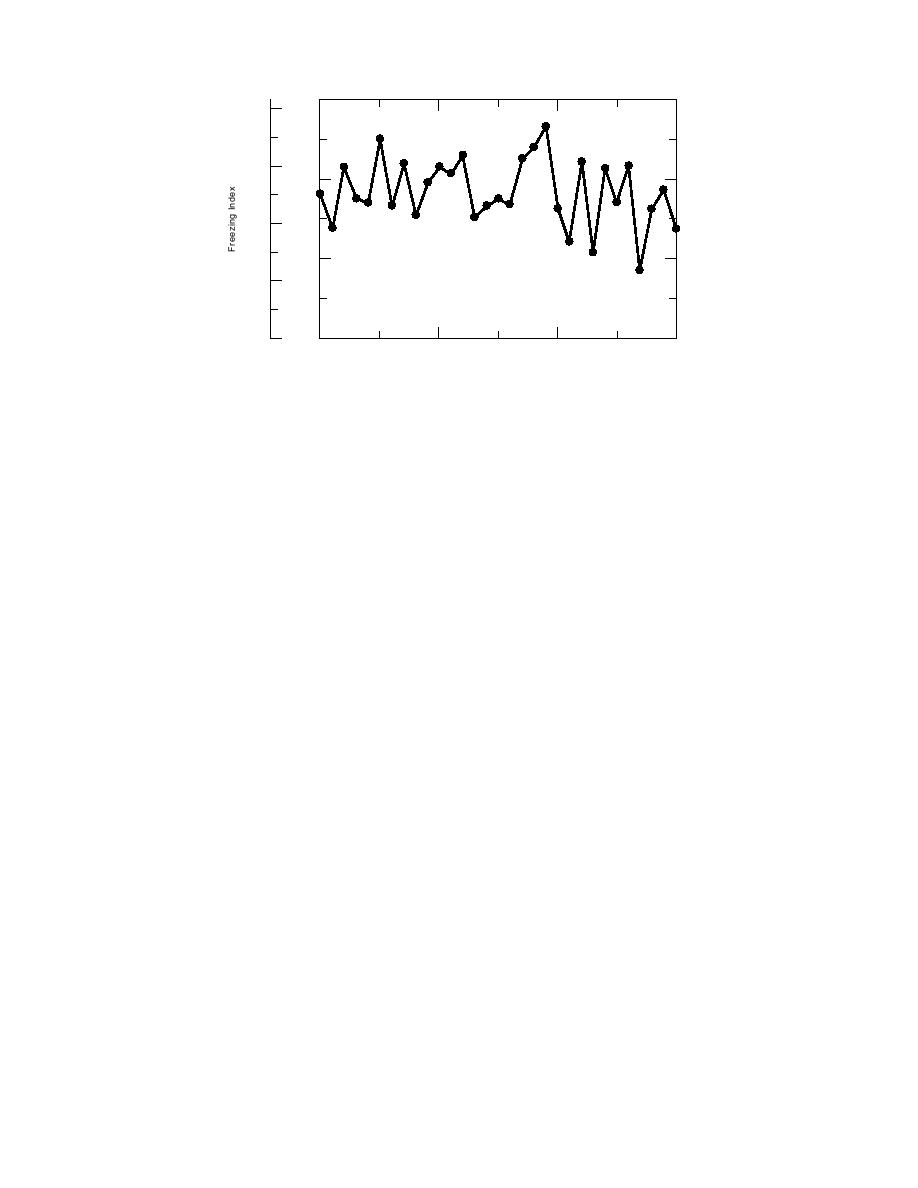
Figure 17. Distribution of seasonal freezing index with time at Buffalo,
Minnesota.
freezing indices (an indication of winter severity)
PERFORMANCE
in Buffalo, Minnesota, at a site about 16 km (10
PREDICTIONS
mi) south of Mn/ROAD (Fig. 17). It was decided
Performance predictions using the Mechanistic
to simulate the 19591960 winter, which had an
Pavement Design Procedure were conducted in
index very near the average value for the period.
three major efforts:
The actual days simulated were 1 October 1959 to
Phase 1, conducted in the spring of 1991, in-
14 November 1960, a span of 410 days that al-
cluded an initial simulation series that modeled
lowed some time prior to the start of freezing and
temperatures from a year close to the mean freez-
included the entire subsequent thaw season.
ing index. These boundary conditions were applied
to eight flexible and three rigid sections.
Pavement sections
Phase 2, an effort in the summer of 1992, had
The mechanistic pavement design procedure
two primary objectives. Phase 2A included three
was applied to 11 test sections, which were dis-
series modeling the eight flexible sections with
tributed among the designs as follows: four 5-yr
the mean freeze season and changing the method
flexible, four 10-yr flexible, two 5-yr concrete,
employed to calculate the asphalt and subgrade
and one 10-yr concrete (Fig. 18). Water table
modulus. Phase 2B investigated the variability in
depths were modeled based on field measurements
predictions when temperatures from freeze sea-
at the site. Seven of the test sections had variable
sons with maximum and minimum freezing indi-
water table depths along their lengths, and these
ces are applied to a single flexible section.
were simulated at the two extreme water table
Phase 3, an effort in the summer of 1993, ex-
positions. Table 13 lists the test sections and water
panded the investigation of the effects of freeze
table conditions simulated as well as the nomen-
season characteristics. This series modeled 21 dif-
clature used to denote the various cases. The no-
ferent freeze seasons applied to one full-depth and
menclature includes the Mn/ROAD test section
one conventional flexible section.
number and the water table depth (in ft) preceded
by a "w." For example, f1w9 refers to Mn/ROAD
test section ML5-F-1 with a water table 9 ft below
Phase 1
the pavement surface and r11w6 refers to section
Simulation period
ML10-R-11 with a water table 6 ft below the pave-
Prior to conducting the initial series of simula-
ment surface. All but one case involved the high-
tions, we analyzed the distribution of seasonal air
heaving subgrade (sample 1206) beneath the pave-
26


 Previous Page
