(lb/in.2 )
(kPa)
(lb/in.2 )
(kPa)
6
106
7 x 10 6
7 x 10 6
10
1206 Unfrozen
115 lb/ft 3
5
7 x 10 5
7 x 10 5
105
108
10
105
Calculated σd (lb/in.2 )
4
7 x 10 4
104
7 x 10 4
10
0.5
Density (lb/ft 3)
1.0
High
114 - 117
4.0
Medium
107 - 110
10
104 - 106
Low
14
3
7 x 10 3
7 x 10 3
103
10
100
80
60
40
100
80
60
40
Degree of Saturation (%)
Degree of Saturation (%)
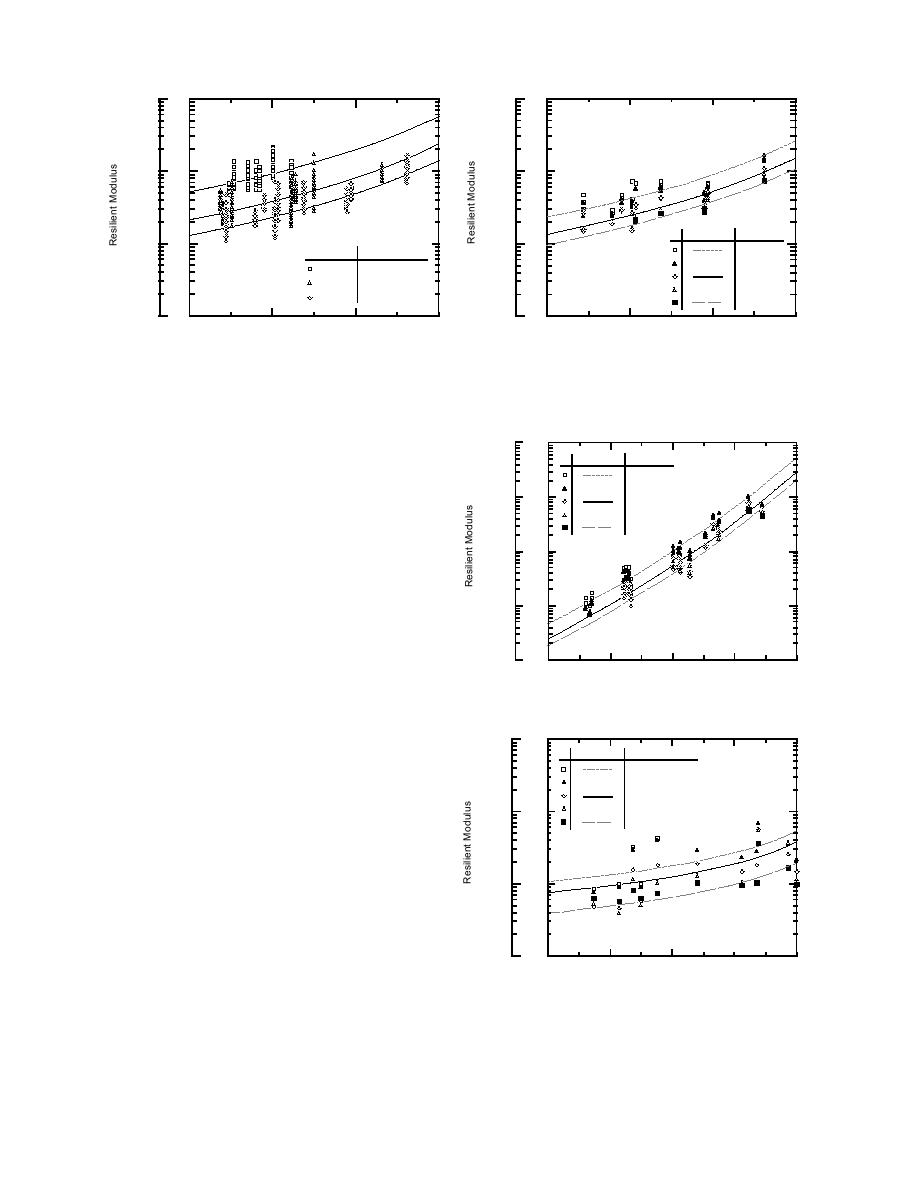
a. Low-density (104106 lb/ft3) 1206 subgrade.
Figure 15. Resilient modulus of never-frozen 1206
subgrade material vs. degree of saturation illus-
(The data in this figure are probably in error--see
trating the effect of dry density.
text.)
(lb/in.2 )
(kPa)
106
7 x 10 6
Calculated σd (lb/in.2 )
fluence the unfrozen moduli, but to different de-
0.5
grees, depending on the material. The vertical
1.0
7 x 10 5
105
spread in the data points at a particular degree of
5.0
saturation is the result of the material's response
9.0
14
to the different stress combinations applied (Table
104
7 x 10 4
11a). In the case of the 1206 subgrade and the
class 6 base, it also relates to the variation in den-
sity.
103
7 x 10 3
To show the influence of density in the 1206
subgrade data, Figure 15 differentiates the data
1232 Unfrozen
from three density ranges (high, medium, and low),
102
2
7 x 10
100
90
80
70
60
along with the corresponding predicted moduli
Degree of Saturation (%)
lines.
b. 1232 subgrade.
The effect of stress combinations is shown in
(lb/in.2 )
(kPa)
Figure 16 for the low-density 1206 subgrade data,
106
7 x 10 6
Calculated J2 /τoct (lb/in.2 )
and all of the 1232 subgrade and class 3 special
data. The two subgrades display an inverse rela-
640
330
tionship between modulus and deviator stress; the
117
7 x 10 5
5
class 3 special has a proportional relationship be-
58
10
5
tween modulus and the stress parameter J2/toct.
After the resilient modulus testing was com-
pleted, we discovered a calibration error in the
7 x 10 4
104
system used to test the 1206 subgrade in the un-
frozen condition; these data are probably in error.
Testing the 1206 subgrade in the frozen condition
Class 3 Subbase
and all testing on the other materials were done
7 x 10 3
103
with a different system, which passed its calibra-
100
80
60
40
20
Degree of Saturation (%)
tion checks. Comparing test results from the 1206
c. Class 3 subbase.
subgrade with those from other materials indi-
cates that unfrozen Mr data for the1206 subgrade
Figure 16. Resilient modulus vs. degree of satura-
may be about an order of magnitude too high.
tion illustrating effect of stress parameters.
25


 Previous Page
