(kPa) (lb/in.2 )
107
7
7 x10
d
Calculated
7 x 10⁶
106
105
7 x 10⁵
Calculated
4
7 x 10⁴
10
wu/w t
wu-g
Class 4 Subbase
wu-v
Albany Taxiway A
3
3
10
7 x 10
-10
-8
-6
-4
-2
0 100
80
60
40
Temperature (C)
Degree of Saturation (%)
(kPa) (lb/in.2 )
8
8
10
7 x10
e
Calculated
107
7 x 10⁷
106
7 x 10⁶
105
7 x 10⁵
Calculated
104
wu/w t
7 x 10⁴
wu-g
Class 5 Subbase
wu-v
Dense-graded Stone
103
7 x 10³
-10
-8
-6
-4
-2
0 100
80
60
40
20
Temperature (C)
Degree of Saturation (%)
(kPa) (lb/in.2 )
8
7 x10⁸ 10
f
107
7 x 10⁷
106
7 x 10⁶
Calculated, Log Log
105
5
7 x 10
Calculated
wu/w t
104
7 x 10⁴
wu-g
Calculated, Semi Log
wu-v
Class 6 Base
103
7 x 10³
0 100
80
60
40
20
0
-10
-8
-6
-4
-2
Temperature (C)
Degree of Saturation (%)
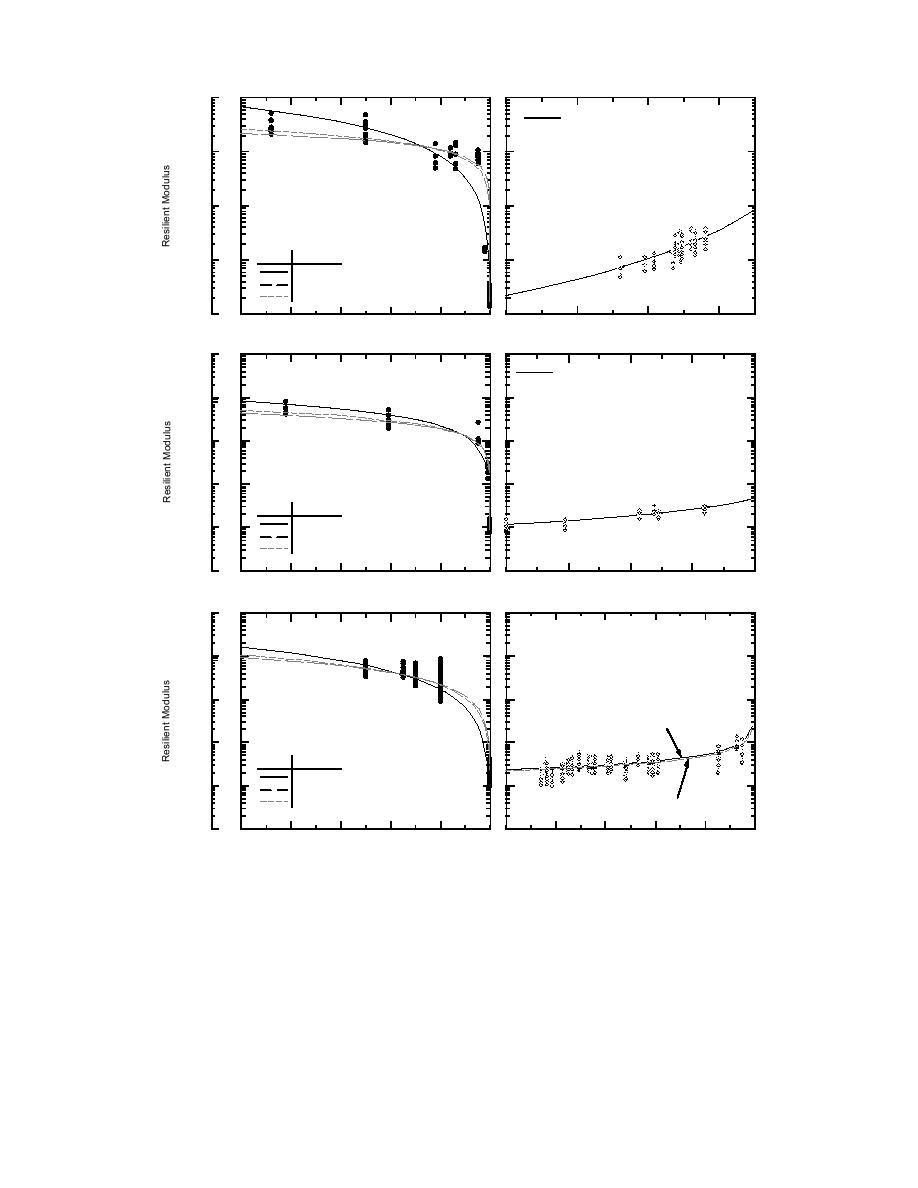
Figure 14 (cont'd). Frozen and unfrozen modulus data compared with calculated moduli
from predictive equations.
The right-hand graphs in Figure 14 show the
Also shown is a line representing the predicted
resilient modulus data vs. degree of saturation for
resilient moduli resulting from the equations given
the unfrozen specimens. For the two subgrade
in Table 1, at the mean stress level tested. Where
materials, data are from specimens that were never
dry density is included in the equation, it was set
frozen; data from the base materials are from speci-
at the average value of all specimens tested. It can
mens that were thawed subsequent to freezing.
be seen in Figure 14 that moisture level does in-
24


 Previous Page
