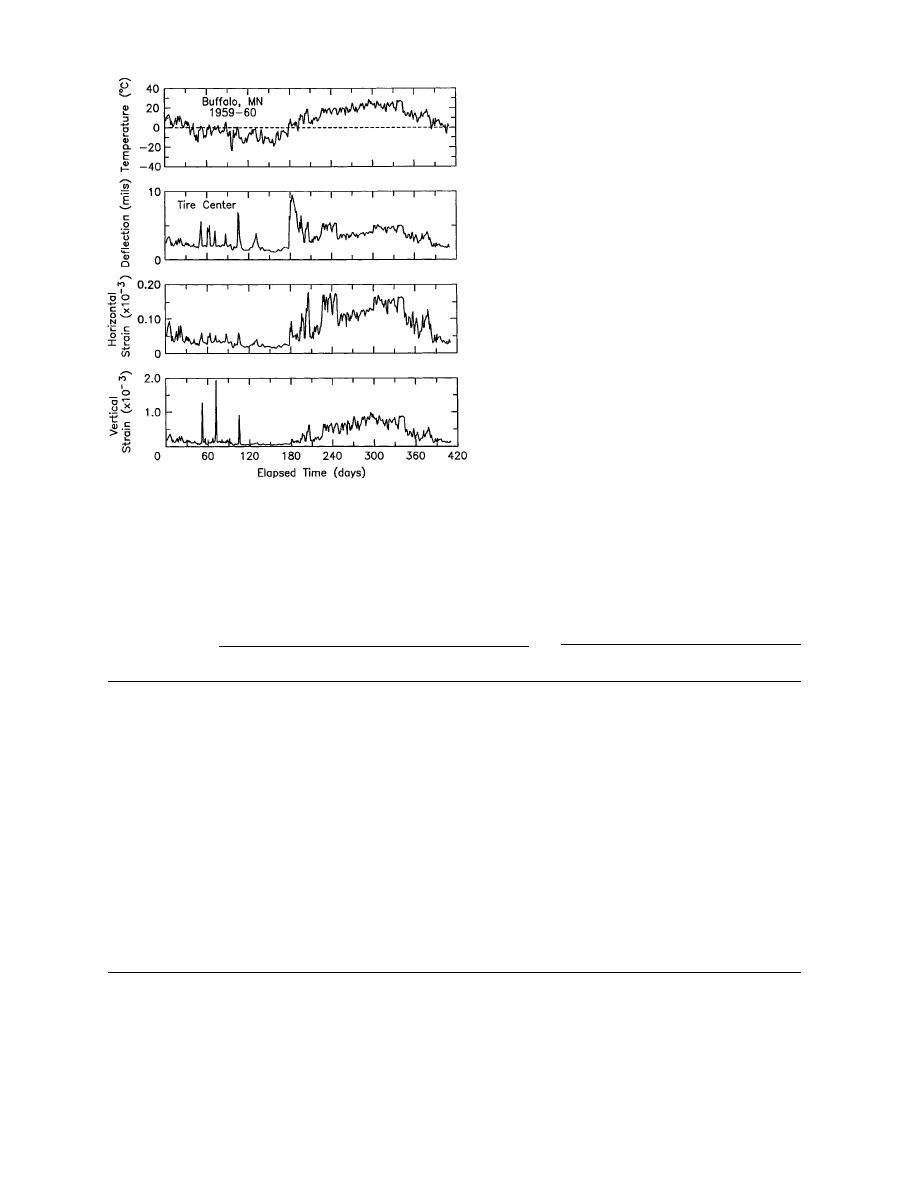
Figure 21 shows the deflection and strains
computed by NELAPAV for the f4w6 case. The
horizontal strain at the base of the asphalt is
small through the winter with a few small peaks
during short-term thawing periods. It then ex-
hibits high peaks during spring thaw and sum-
mer. It appears to be closely related to the as-
phalt temperature/modulus during the spring
thaw. The vertical strain at the top of the sub-
grade is also low during the winter with three
sharp peaks during thaw events. The vertical
strain also rises during spring and summer,
closely tracking the pavement surface tempera-
ture. The deflection plotted is from the base of
the asphalt, but is assumed to be similar to the
surface deflection. It also shows peaks during
midwinter thaws, and a maximum peak during
spring thaw prior to drainage of excess subsur-
face moisture. Generally, deflections in the sum-
mer are greater than winter values.
Table 15 lists the applications to failure pre-
Figure 21. Deflection and strain calculated by
dicted from the 1-yr simulation period applied
NELAPAV for Mn/ROAD test section ML5-F4 with a 1.8-
to the flexible sections. The values listed in
m (6-ft) water table. Horizontal strain is at the base of the
Table 15 were determined by taking the recipro-
pavement. Vertical strain is at the top of the subgrade.
cal of the one year (365-day) cumulative damage
Table 15. Predicted applications to failure (1000) from Phase 1 simulation series of flexible pavement test
sections.
Horizontal criteria
Vertical criteria
Asp. Inst.
Asp. Inst.
Corps of
Coetzee/
Asp. Inst.
Corps of
Cases
MS-1
MS-11
Engineers
Connor
MS-1
Engineers
FAA
5-Year
F1W9
86
498
88
4,380
136,942
5,653
11,879
F2W9
522
1,244
550
42,703
32,477
1,345
1,526
F2W20
722
1,534
764
66,450
155,909
8,226
9,855
F3W8
957
1,706
958
92,419
116,287
2,653
9,611
F3W20
1,068
1,801
1,055
105,202
222,462
7,889
20,632
>107
F4W6
28,585
75,751
90,926
3,715
15
152
>107
>107
>107
F4W6ld
1,905
20,209
7,036
165
>107
>107
>107
>107
F4W6ss
72
1,180
96
10-Year
> 107
F14W50
103,272
485,198
605,194
8,602
10
251
F19W18
396
6,148
966
75,751
2,962,263
56,680
457,585
F21W18
3,394
30,456
12,751
2,010,107
562,830
84,382
42,478
F21W45
3,404
30,358
12,794
2,010,107
611,772
92,571
48,188
F22W45
7,614
57,315
31,147
8,040,429
73,190
22,415
3,388
Notes:
ld = low density (1.69 Mg/m3 or 105.5 lb/ft3)
ss = second subgrade (1232)
Traffic simulated at rate of 562,830 ESAL applications/yr.
31


 Previous Page
