lence and the potential for transporting greater
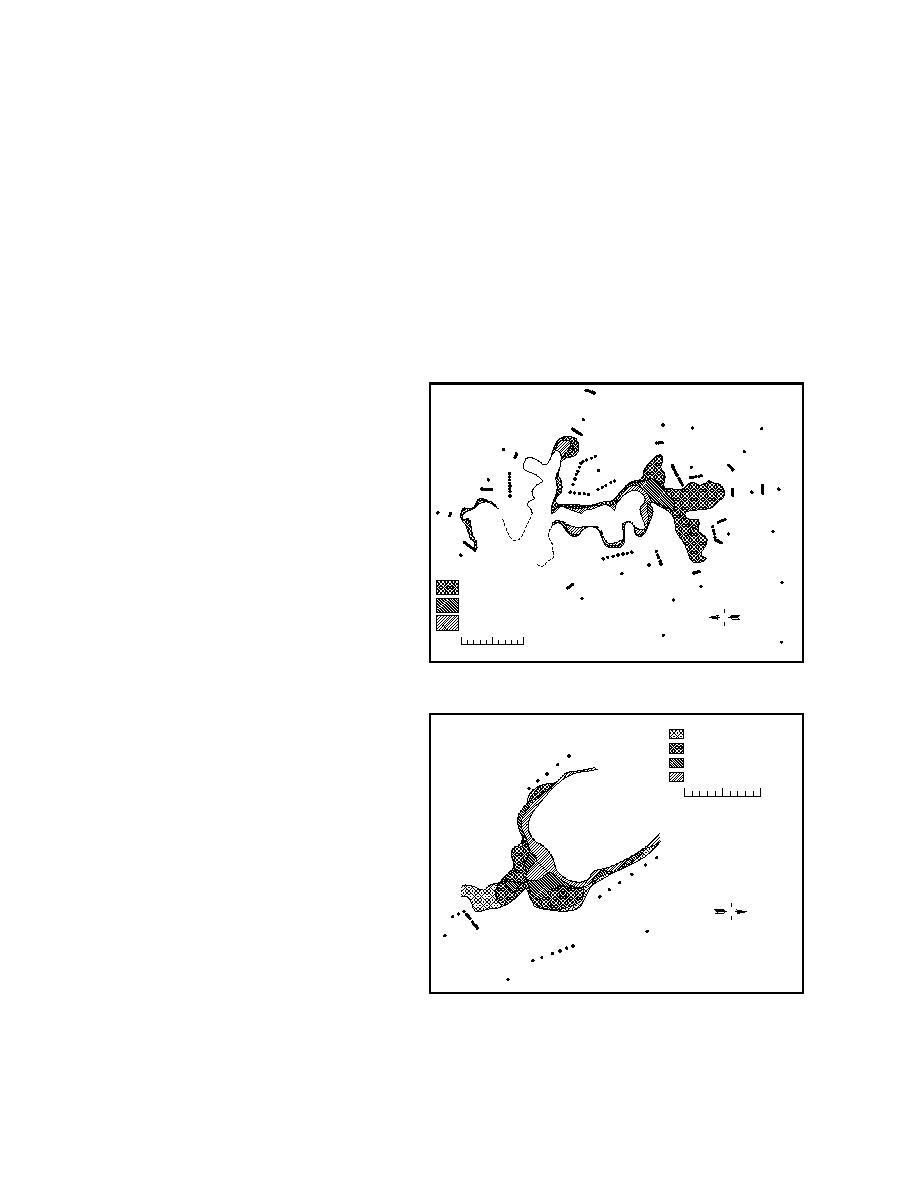
Maximum recession rates ranged from 0.3 to 3.2
amounts of sediment. Perhaps more importantly,
m during MaySeptember 1992, 0.1 to 1.3 m dur-
additional energy is released from the stored po-
ing September 1992 to June 1993, and 0.1 to 3.3 m
tential energy of the elevated flood waters, caus-
during JuneSeptember 1993. During the winter
ing scour and sediment entrainment. Thus, tidal
of 1993, erosion rates ranged from 0.1 to 5.0 m, 0.1
discharge during ebb is more erosive than during
to 2.0 m in the summer of 1994, 0.1 to 11.7 m
flood.
during the winter of 1994, and 0.1 to 20.0 m dur-
Discharge (Q) was estimated for each moni-
ing the summer of 1995. Net headward recession
tored gully using the peak and mean velocities by
ranged from 0.1 m to about 33 m between 1992
and 1995, with a maximum of 33 m occurring
Q = VA
since the spring of 1994 at Bread Truck Gully (Fig.
23a). At each site, however, some parts of the
where V is velocity and A is the cross-sectional
scarp crests did not retreat at all.
area.
Extension of the hub to scarp distance was
Average discharge values calculated for each
gully ranged from 0.12 to 3.36 m3/s during flood
measured where tension cracks developed at an
and 0.25 to 6.60 m3/s in ebb (Table 7). Peak
ebb discharge at each site ranged from 1.16
to 12.30 m3/s. Peak and average TSS con-
centrations collected over the same time
intervals provide rough estimates of flood
and ebb sediment fluxes through gullies
(Table 7).
These data indicate ebb sediment flux is
greater than the flood sediment flux, with
average sediment flux ranging from 0.03
to 1.99 kg/s during flood and 0.08 to 2.79
kg/s during ebb (Table 7). This difference
in flux reflects the ebb and flood asymme-
try. The significance of the data in terms of
S
May to Nov 1995
sediment transfer is not as clear. These data
Sep 1994 to May 1995
N
suggest that, over time, there should be a
ep 1993 to Sep 1994
net transfer of sediment into Knik Arm.
0
5
10 m
However, they do not account for sedi-
ment flux via flood waters that overflow
a. Bread Truck Gully.
the Eagle River and gully banks and levees
and, therefore, may be misleading.
May 1995 to Oct 1995
Gully erosion and
J ay 1994 to May 1995
M ne 1993 to May 1994
u
scarp recession rates
ay 1992 to Jun 1993
Gully erosion and recession were moni-
tored to assess current rates of extension
0
5
10 m
into ponds and the potential for pond
drainage and in-situ WP degradation.
These short-term rates were compared with
long-term trends analyzed on aerial pho-
tographs of selected gullies. These histori-
cal rates also define variations in gully ex-
N
tension across ERF and are an independent
check on field measurements.
Modern rates
The amount of recession of scarp crests
b. Parachute Gully.
is highly variable within a particular gully,
Figure 23. Summary of gully scarp recession.
as well as among all gully sites (Table 8).
31


 Previous Page
