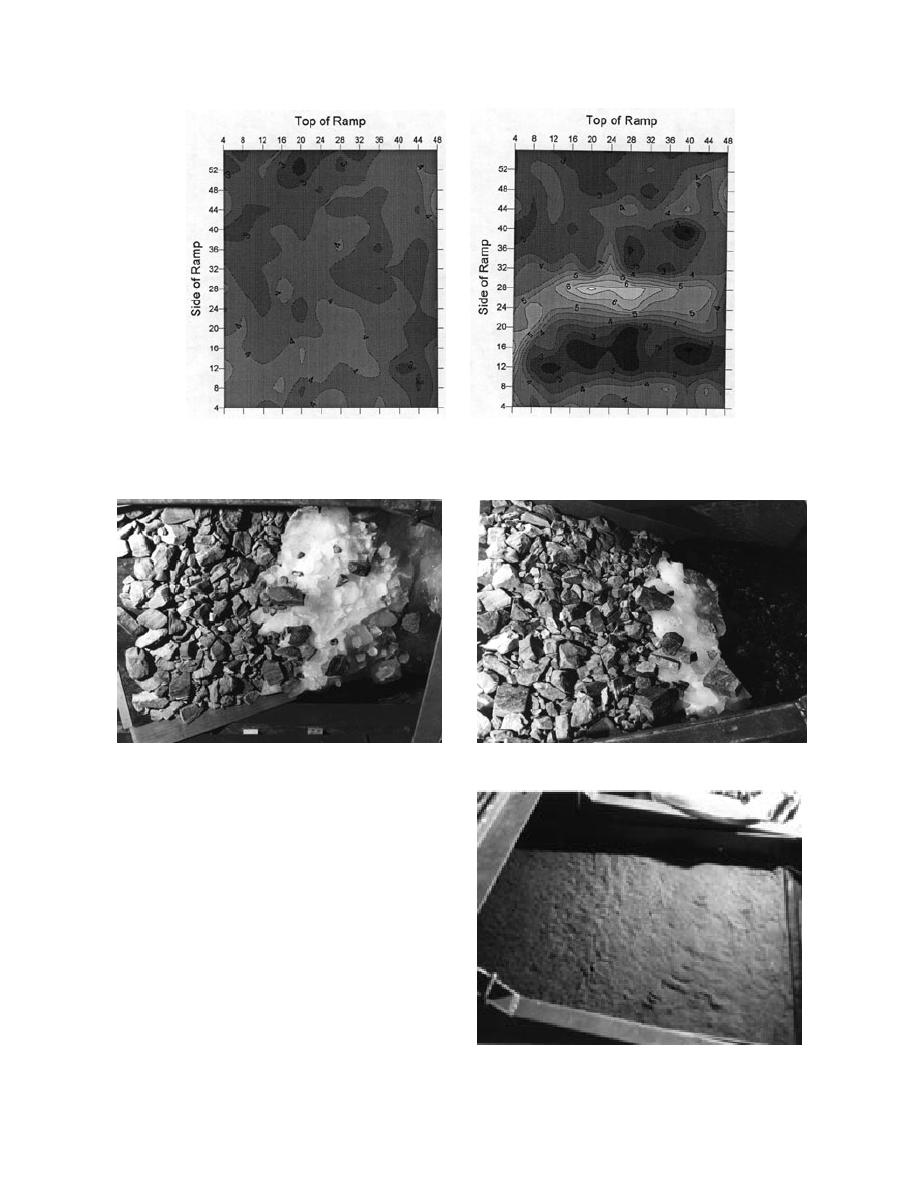
a. Before.
b. After.
Figure 27. Contour plots of the model riprap before and after test 5. These contour plots show
both extent and amount of rock movement during test 5. The numbers along contour lines denote
measured distance from the string in the grid frame.
Figure 28. Rocks found on top of the ice pile during melting of ice after test 20.
this particular test, we allowed the ice to melt on
top of the damaged riprap and observed that the
model bank was barren of rock under the last bit of
ice, as shown in Figure 28. Later, when the ice melted
away completely, the rocks on top of the ice were de-
posited onto the barren patch, though not quite cov-
ering it. We observed this "self healing" behavior in
many tests after an ice pileup. In the open-water bank
protection by riprap, this self healing of riprap also
takes place, which makes riprap a popular choice for
projects that require low maintenance.
After an ice run on the smallest stone size (test
8), we observed that the ice sheet had deformed the
sand bed as well as the riprap, as shown in Figure
29. After test 30, we observed a far greater amount
of ice damage than usually encountered; the ice tore
Figure 29. Sand bed of model bank deformed by ice
the filter fabric (Fig. 30). These observations indi-
action after test 8.
18


 Previous Page
