1.0
0.8
0.6
0.4
Slope 1V:3H
Slope 1V:2H
0.2
Slope 2V:3H
Combined Data
0
0.5
1.0
1.5
2.0
2.5
Ice Thickness/Rock Size (h/D100)
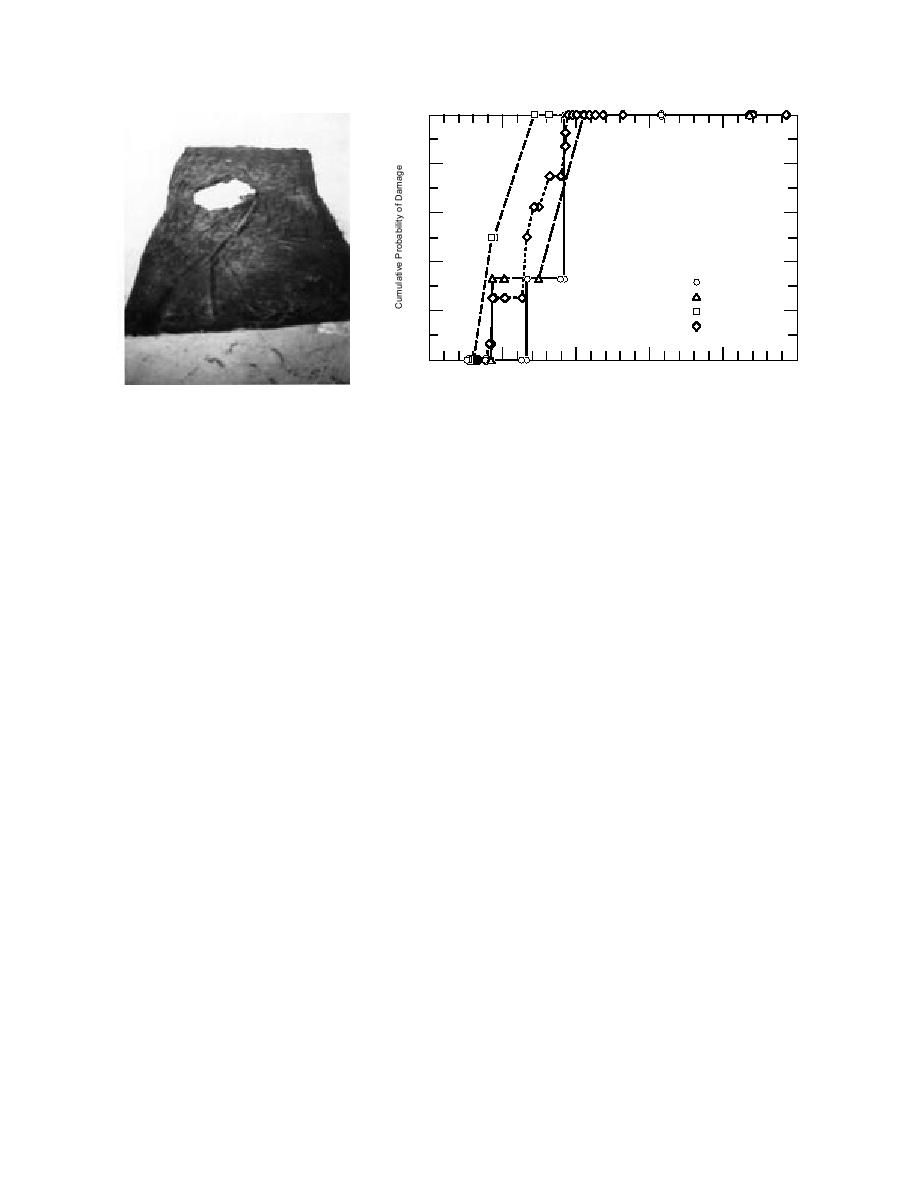
Figure 30. Damage to filter fabric by ice
Figure 31. Plot of cumulative probability of damage vs. the ratio of
action after test 30.
ice thickness to D100 rock diameter.
cate that the small-stone riprap was not only in-
ed to the ratio of ice thickness to the maximum rock
adequate to resist these ice actions, but also made
diameter and ranked this ratio from smallest value
the underlying bank material highly vulnerable
to the largest value. When the outcome of a test was
to damage by ice.
associated in terms of riprap failure or nonfailure,
In Table 1, we have given numerical values to
we found that there was no damage to the riprap
when the ice thickness was small compared to the
the level of riprap failure, as visually apparent to
maximum rock size. On the other hand, we found
us in terms of exposure of filter fabric underneath
that the ice sheet always damaged the riprap when
the stones. A failure level designated by 0 was
it was large compared to maximum rock diameter.
assigned to tests when we did not observed signif-
In Figure 31, we have plotted these results for each
icant displacement of rocks. A failure level desig-
bank slope in terms of cumulative probability of rip-
nated by 1 was assigned to slight damage during
rap failure vs. ratio of ice thickness to D100 rock diam-
tests in which we observed small areas, on the
order of 20 cm2 (3 in.2), of filter fabric. A failure
eter. There was a range of ice-thickness/rock-size
levels designated by 2 was assigned to damages
ratios in which the damage to the riprap was ran-
in those tests where we observed moderate area
dom.
of riprap damage (2065 cm2 or 310 in.2). Lastly,
The plots in Figure 31 show that the values of
a failure level of 3 was assigned to damages in
ice-thickness/rock-diameter (h/D100) ratio at which
those tests in which we observed large areas of rip-
transition from nonfailure to failure takes place de-
rap gouged from the bank, resulting in exposed bank
crease with the increase in the bank slope angle. By
areas of 65 cm2 (10 in.2) or more. In Appendix D, we
combining the data from all tests for the three bank
have also presented the photographs of the riprap
slope angles, we have plotted the cumulative prob-
taken before and after each test.
ability of riprap failure with respect to the ratio of
ice thickness to nominal rock diameter. These plots
indicate that there is no damage to the riprap when
Failure and nonfailure of riprap vs.
h/D100 is less than 0.35 and that the riprap is always
ratio of ice thickness to rock size
The damage to the riprap takes place as a result
damaged when h/D100 is greater than 1. From the
of interaction between an ice sheet and an indi-
results shown in Figure 31, the riprapped banks
vidual rock. However, we do not know the exact
with shallow slope (1V:3H) are less prone to dam-
nature and magnitude of the ice pressure on an
age by ice shoving than those with steeper slopes
individual rock. It is for this reason that we have
(1V:1.5H). For shallow slope (1V:3H) banks, the rock
done model tests, as in the case of waves and cur-
size should be about twice the ice thickness to sus-
rents, to determine the ice damage to the riprap.
tain no damage by ice shoving. For steeper slopes
We conducted model tests with three bank
(1V:1.5H), the rock size (D100) should be about three
slopes, and the damage the riprap was noted in
times the ice thickness to prevent damage by ice
each test. For each bank slope angle, we calculat-
shoving.
19


 Previous Page
