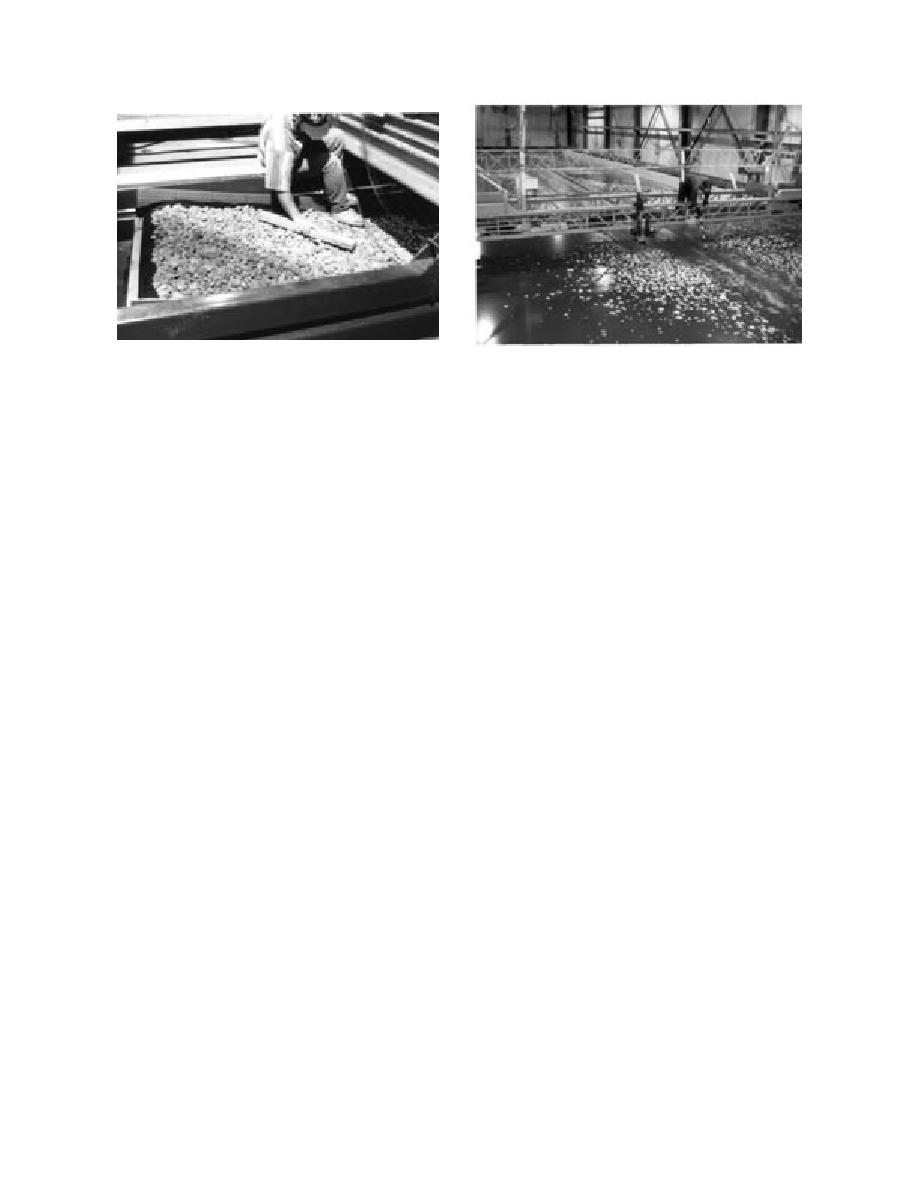
Figure 14. Leveling rocks of model riprap in final prep-
Figure 15. Cutting of slots in the model ice sheet prior
aration prior to each test.
to each test.
riprap bank. Some of the observations made dur-
ing and after each test.
ing the tests are given below.
After measuring and documenting the ice prop-
erties, we cut slots in the ice sheet along the length
Observations on ice ride-up and pileup
of the tank using chain saws mounted on a slow-
We observed ice ride-up only during two tests:
moving carriage (Fig. 15). These slots were locat-
3 and 18. The slope angle α of the bank in both
ed such that the ice would not hit the side walls of
these tests was 18.4 (1V:3H). During an ice ride-
the model riprap bank. This left a long strip of ice
up event, we observed that the ice sheet was be-
sheet no wider than the model bank, approximate-
ing pushed up the riprap slope and continually
ly 1.22 m (48 in.) wide, and as long as the test ba-
slid up and over the top edge of the model and
sin, approximately 30 m (100 ft) long. On each side,
back into the tank. During the ice ride-up events,
we cut two more slots 15 cm (6 in.) apart, and re-
the ice sheet dislodged some rocks upon initial
moved the ice between these slots.
impact, but generally did not displace enough
Immediately prior to each test run, we record-
rocks to expose the bank. Figure 16a shows an ice
ed the initial values measured by the load cells.
sheet riding up the model riprap bank for test 3.
When we moved the carriage, the model riprap
The action of the ice sheet sliding on top of the
moved against the model ice sheet. We continued
riprap shaved the underside of the ice sheet and
the test as long as there was sufficient ice to shove
filled in the interstitial spaces between the rocks,
onto the model bank. After completion of each test,
causing the riprap surface to become smooth. Fig-
we recorded final force values.
ure 16b shows the riprap surface filled with ice
We made video recordings of the ice interac-
shavings after we removed the ice sheet. Figure
tion with the model bank during each test. We re-
17a and 17b show the riprap bank before and af-
corded the first eight tests from the front, and the
ter test 3, respectively. As can be seen, there was
remaining tests from the side. Some of the video
very little displacement of the riprap.
recordings show the initial ice ride-up, followed
During the initial stages of a test with a pileup,
by a gradual transition to ice pileup.
an ice sheet would contact the riprap, break into
After the ice pile was removed from the model,
pieces, and ride up on top of the riprap, as shown
we photographed the rocks again from the same
in Figure 18. Although the ride-up continued for
position above the model to serve as a record of
a long time in a few tests, the ice would usually
rock displacement. We profiled the rocks again us-
pile up above the waterline and offer resistance to
ing the grid technique explained above.
the incoming ice pieces. As the ice pile grew larg-
er, there were instances when we observed an ice
RESULTS
sheet pushing under the ice pile, gouging the mod-
el riprap, and bringing up small stones (Fig. 19).
As mentioned earlier, Table 1 lists the values of
Figure 20 shows a sequence of photographs of an
parameters or variables that were either set or
ice pileup during its formation. These photographs
measured during each test. It also lists the maxi-
were taken during test 20, in which the bank an-
mum horizontal force measured during each test
gle was 27 (1V:2H) and the ice thickness was 53
as well as the severity of damage to the model
12


 Previous Page
